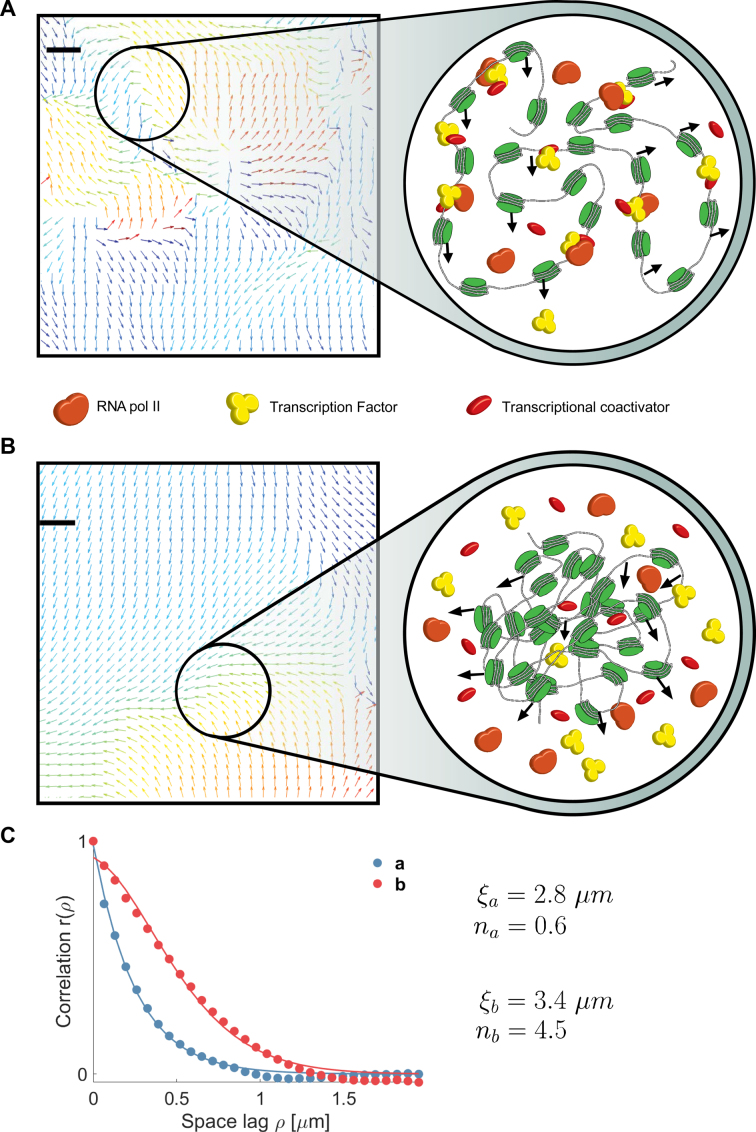
Figure 6.
Representative magnification of flow fields illustrating flow smoothness and models of proposed mechanisms. The observed change in smoothness between serum stimulation (A) and starvation (B) in case of DNA probing is visualized by representative regions (Supplementary Figure S4). The observed low smoothness after serum stimulation may reflect chromatin decompaction. Chromatin is able to move rather freely and RNA pol II and transcription factors can bind to DNA. Coherent motion and sharp motion boundaries were observed and suggestive of defined DNA-processing hubs or factories. In case of serum starvation, correlation drops and coherently moving regions seamlessly interrelate. An increase in chromatin compaction causes DNA–DNA interactions to occur more frequently resulting in smooth spatial transitions between directional chromatin motion. Scale bars are 200 nm. (C) Correlation functions for the flow fields shown in panel (A) and (B) are fit to the WM model.

