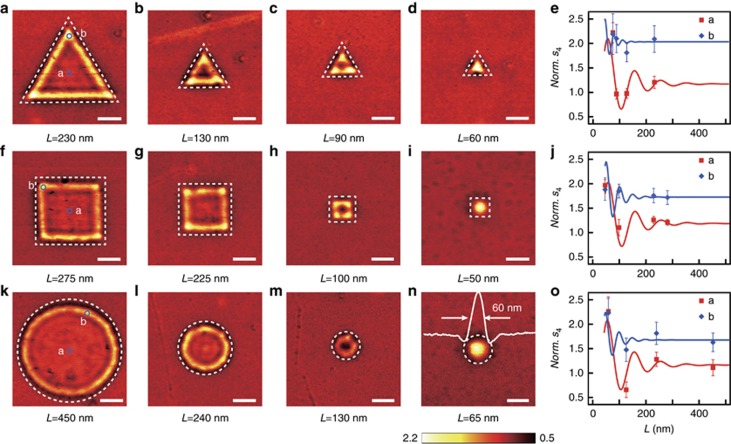
Figure 4.
SP interference patterns of the two-dimensional graphene nanostructures with different sizes and shapes. (a–d,f–i,k–n) Near-field amplitude images within the equilateral triangle, square and circular graphene nanostructures of varied sizes. The white dashed lines indicate the boundaries of the graphene nanostructures. (e, j, o) Normalized near-field amplitudes at positions a (red squares) and b (blue diamonds) marked in a, f and k, respectively. The normalizations are performed by dividing the amplitude at a or b by that of the pristine SiO2 substrate. The red and blue solid lines are theoretical results using the phenomenological cavity model. a–c,f–h,k–m Scale bars=200 nm and d, i, n Scale bars=100 nm.

