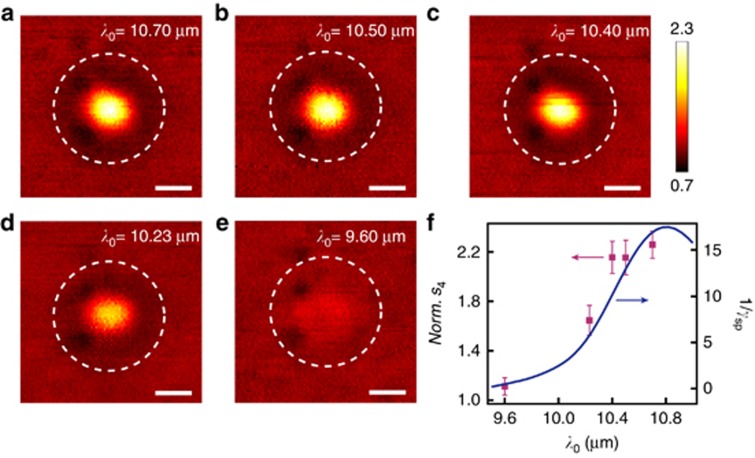
Figure 5.
Dependence of SP interference patterns on the excitation wavelengths in a circular graphene nanostructure. (a–e) Near-field amplitude images within the circular graphene nanostructures using different excitation wavelengths. The diameter is 150 nm. Scale bars=50 nm. The white dashed lines indicate the boundaries. (f) Dependence of the 1/γsp and near-field amplitudes at the nanostructure center on the excitation wavelengths. The near-field amplitudes are normalized to that of the adjacent pristine SiO2 substrate.

