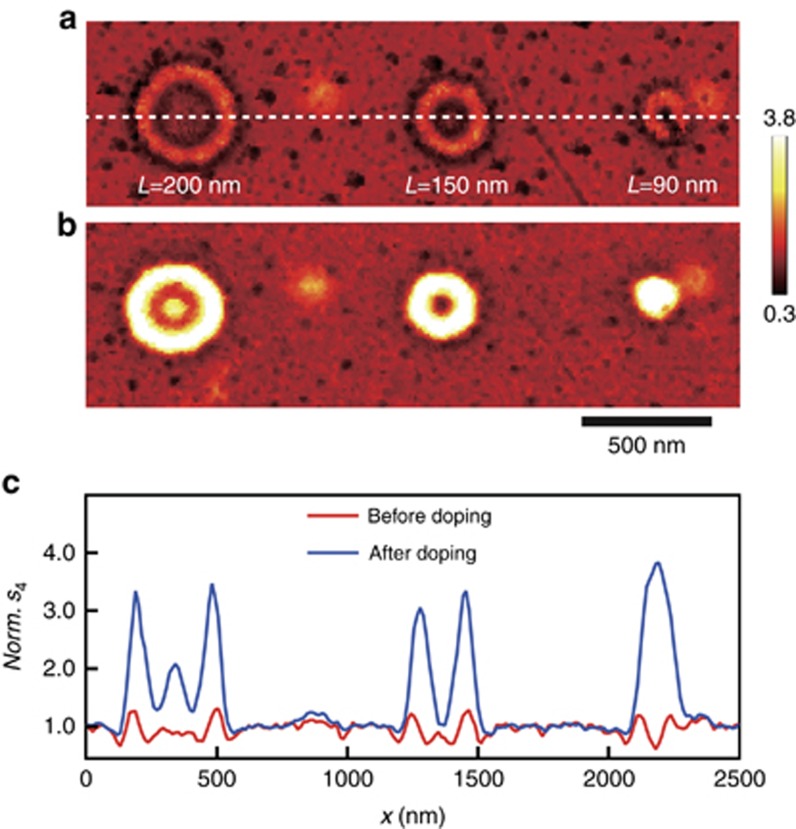
Figure 6.
Comparison of near-field optical images of the circular graphene nanostructure before and after HNO3 doping. The excitation wavelength was λ0=10.70 μm. (a) Normalized near-field optical images of the pristine graphene nanostructures. (b) Normalized near-field optical images of the HNO3-doped graphene nanostructures. (c) Extracted amplitude profiles along the dashed white line which is shown in a. The red and blue solid lines represent the profiles from the pristine and chemically doped graphene nanostructures, respectively.

