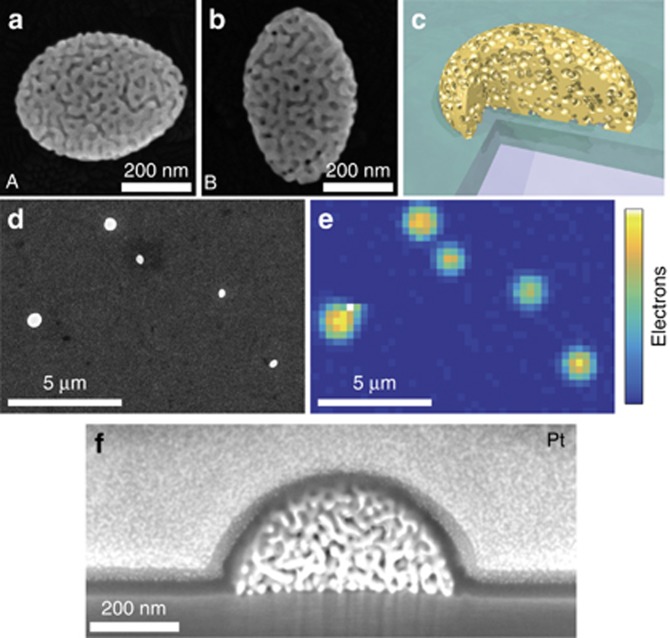
Figure 1.
The gold-nanosponge sample. (a, b) Scanning electron microscopy (SEM) images of two representative gold nanosponges, henceforth called nanosponges A and B, respectively. (c) Cross-sectional model geometry for finite-difference time-domain (FDTD) calculations. The spherical inclusions are overlapping and form a percolating network with a filling fraction of 0.36, comparable to the experimental results. (d) SEM image of the sample surface with several nanosponges. (e) Photoelectron emission microscopy image of the same area of the sample with a single sponge visible. All nanosponges show strong electron emission. (f) Cross-sectional SEM image of a nanosponge underneath a protecting platinum layer that has been cut open by a focused ion beam, revealing the internal percolated structure.

