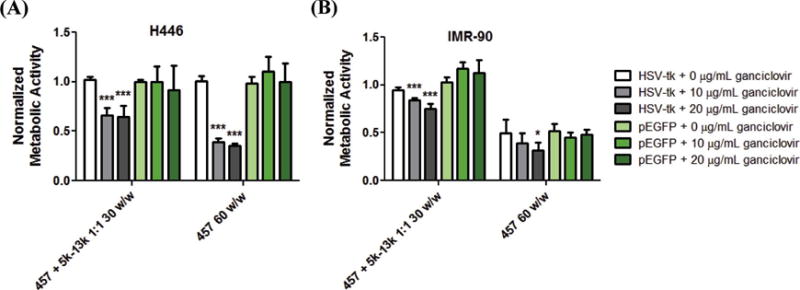
Figure 5.

Cell death measured by MTS assay and reported as normalized metabolic activity to untreated group (not shown). (A) H446 and (B) IMR-90 cells are transfected with the optimized PEG-PBAE polyplex formulation (457 + 5k-13k 1:1 30 w/w) and PBAE polyplexes (457 60 w/w) delivering pHSV-tk, followed by two sequential ganciclovir treatments at either 10 or 20 g/mL dosage. Data are mean ± SD (n=4) (* p < 0.05, *** p < 0.001 compared to pEGFP control of each group).
