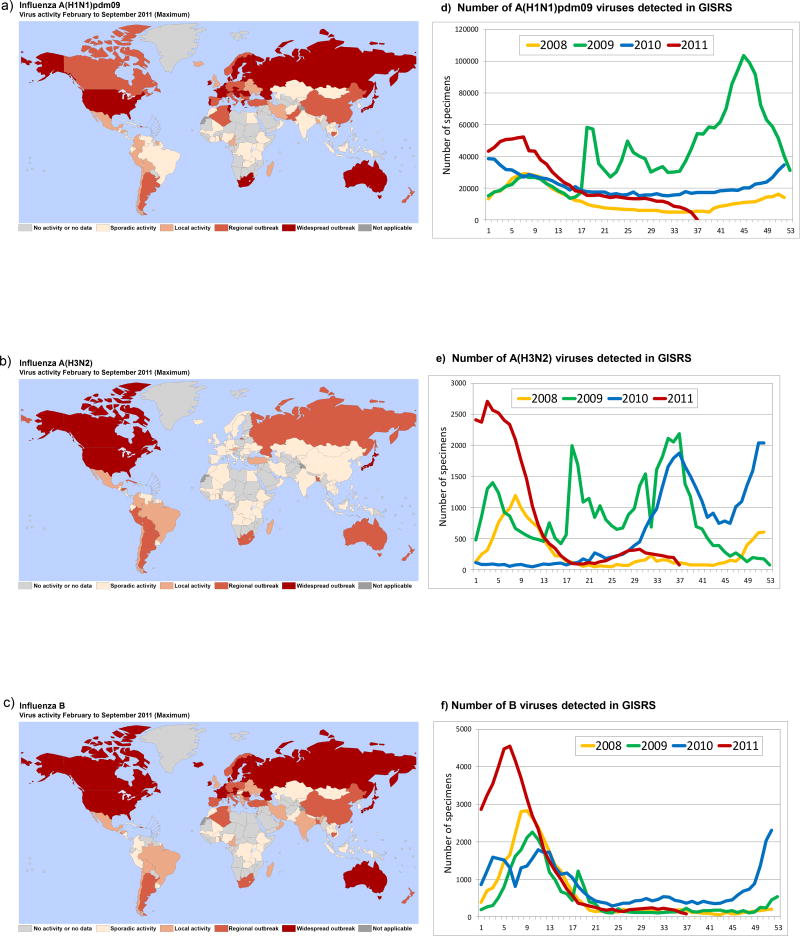
Fig. 1.
Maps showing peak levels of laboratory confirmed influenza (reported to FluNet) in each country with an NIC, for the period February to September 2011: a) A(H1N1)pdm09 viruses; b) A(H3N2) viruses; c) B viruses. The total number of seasonal and pandemic viruses detected by GISRS from February to September 2011 for each type/subtype is shown in panels: d) A(H1N1)pdm09; e) A(H3N2); f) B viruses.

