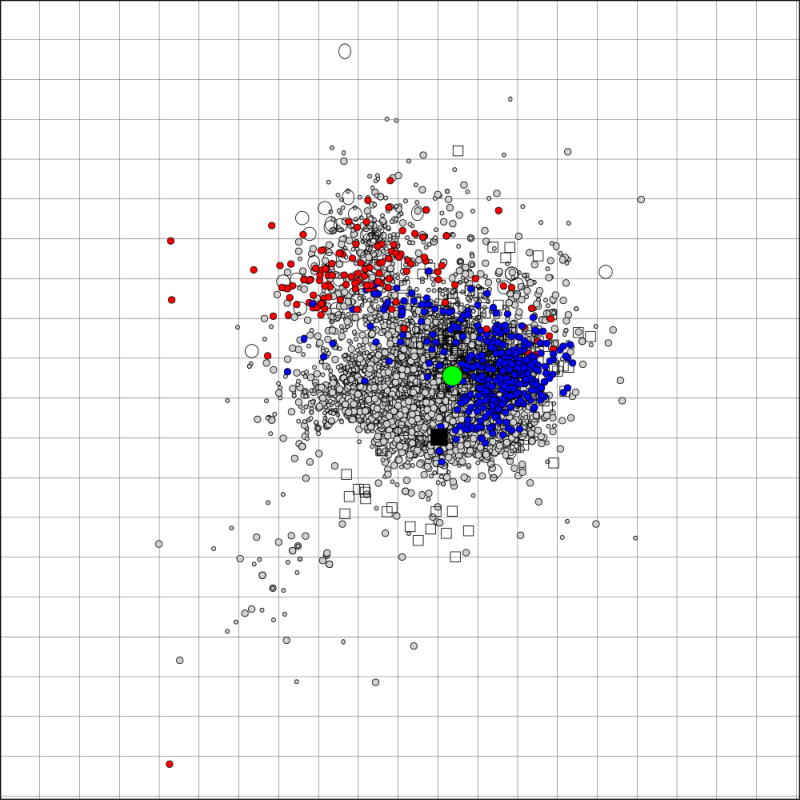
Fig. 3.
An antigenic map [10] generated from A(H1N1)pdm09 HI data from WHO CCs in Atlanta, London, Melbourne and Tokyo from April 2009 – August 2011. Viruses are represented as circles, antisera as squares. The current vaccine strain A/California/7/2009 is represented by the large green dot, 2011 viruses with 8-fold or greater reductions in HI titres to the A/California/7/2009 ferret antiserum are in red, the remaining 2011 viruses in blue. The Grid indicates a 2-fold dilution in HI titre, 1 unit of antigenic distance [10].

