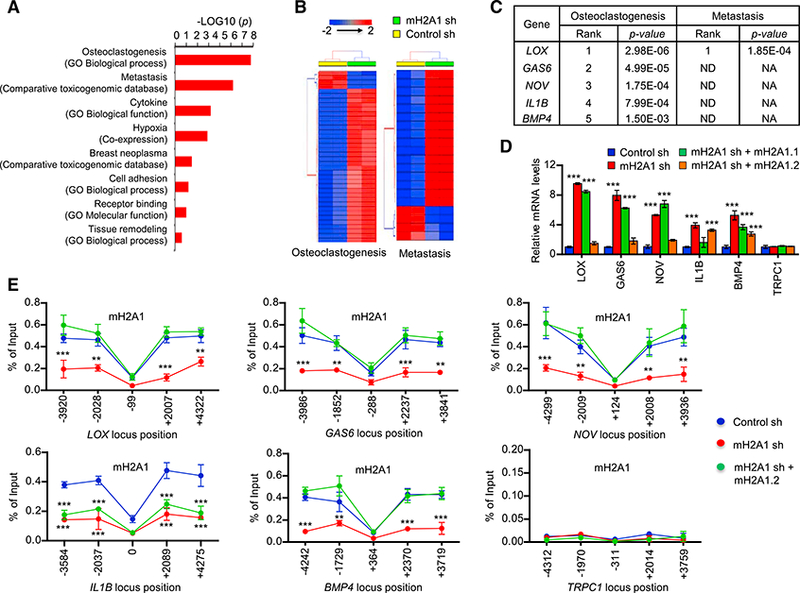
Figure 2. Identification of mH2A1.2 Target Genes in Breast Cancer Cells.

(A) Pathway analysis of breast cancer secretome identified the enrichment of pathways related to breast cancer associated bone metastasis and osteoclas- togenesis in 3,948 secretome genes. A ranked p value was computed for each pathway based on hypergeometric distribution along with Benjamini Hochberg correction (p < 0.05). Datasets used to extract the pathway terms are indicated in parentheses. The genes identified in each pathway are listed in Table S3.
(B) A two-way hierarchical clustering of two representative pathways—osteoclast differentiation and metastasis-showing distinct signature expression profile in mH2A1 sh knockdown and wild-type MDA-MB-486 cells. Euclidean distance and Average linkage were used for clustering.
(C) Prioritization of candidate genes in two important pathways differentially regulated in control and mH2A1-depleted MDA-MB-486 cells. Genes are ranked in the order of their functional statistical significance in a particular pathway. Top five ranked genes in osteoclast differentiation pathway and their corresponding rank in metastatic pathway are shown.
(D) qRT-PCR was performed to quantify relative mRNA levels of the top five genes using primers listed in Table S4. Error bars denote the SD from triplicate reactions by real-time PCR; ***p < 0.001 versus Control sh (ANOVA analysis).
(E) ChIP assays were performed at five different regions of the five mH2A1.2-repressed and one control genes using mH2A1 antibody and primers listed in Table S4. Error bars denote the means ± SD obtained from triplicate real-time PCR reactions; **p < 0.01, ***p < 0.001 versus Control sh (ANOVA analysis).
