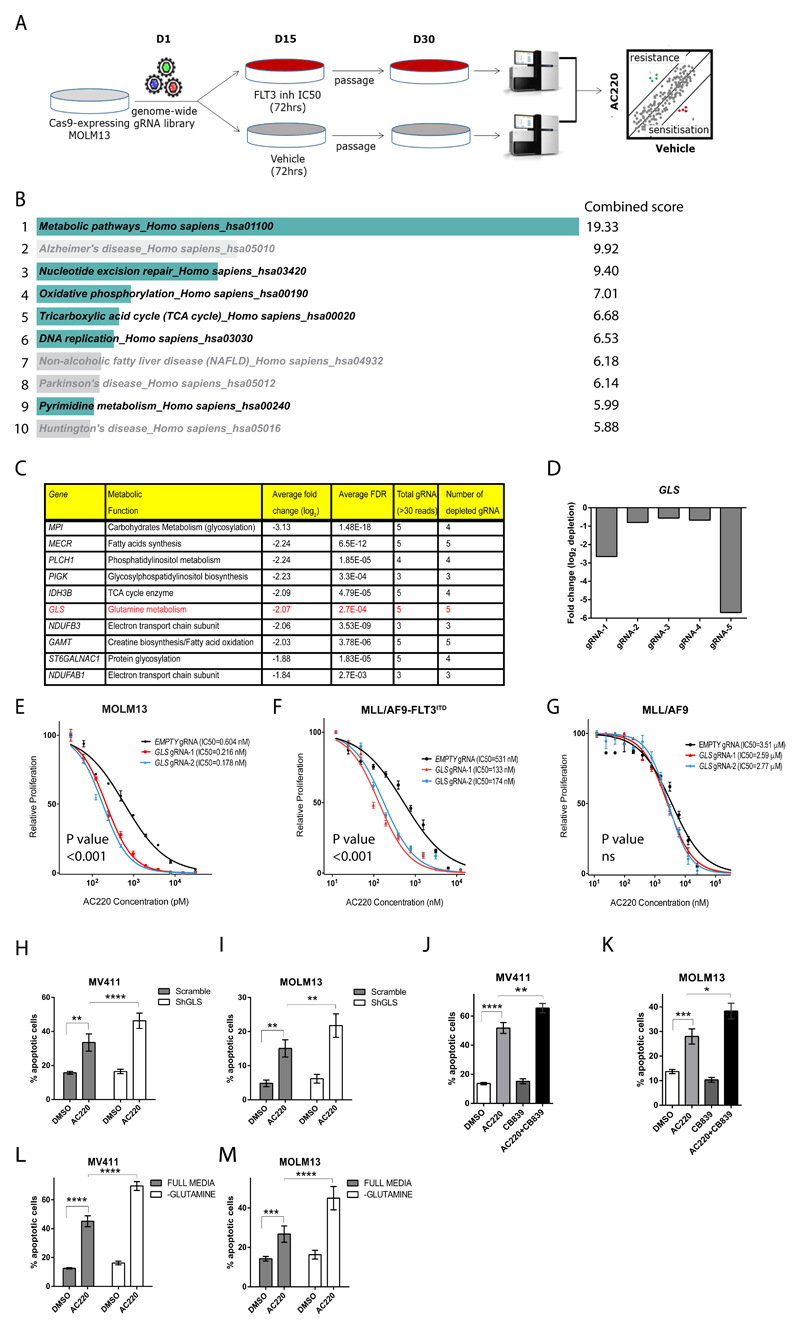
Figure 1. GLS gene deletion and chemical inhibition are synthetically lethal with FLT3 tyrosine kinase inhibitors.
(A) Schematic of the genome-wide CRISPR/Cas9 synthetic lethality screen in the FLT3ITD mutant cell line MOLM13. (B) KEGG pathways enrichment analysis of drop-out genes from CRISPR/Cas9 screen sorted by combined score calculated using Enrichr software35,36. Pathways relevant to AML biology are highlighted while the remaining are grayed out. (C) List of top ten genes from the “metabolic pathways” gene list sorted according to average fold depletion from gRNAs. (D) Bar graph depicting individual fold depletion for each gRNA targeting GLS. (E-G) Growth inhibition curves to AC220 of MOLM13 (E) and murine bone marrow cells expressing MLL/AF9-FLT3ITD (F) and MLL/AF9 (G) transduced respectively with “empty” gRNA control or 2 different gRNA targeting GLS (mean ± s.e.m., n=3, P<0.001 for treatment effect comparing control and both Gls knockout for E and F, ns, not significant for G, two-way ANOVA). (H-I) Apoptosis in the FLT3ITD mutant cell lines MV411 (H) and MOLM13 (I) transduced with control “Scramble” shRNA and GLS shRNA following treatment with AC220 0.5nM for 48hrs (for MV411 mean ± s.e.m., n=7, **** P<0.0001, ** P=0.0086, for MOLM13 mean ± s.e.m., n=3, ** P=0.0014 for AC220 treatments comparison between Scramble and GLS shRNA, ** P=0.0050 for DMSO versus AC220 comparison in the scramble shRNA, two-way ANOVA with Bonferroni’s multiple comparisons). (J-K) Apoptosis in MV411 (J) and MOLM13 (K) following treatment with AC220 1nM, CB839 100nM or their combination (for MV411 mean ± s.e.m., n=14, ** P=0.0033, **** P<0.0001, for MOLM13 mean ± s.e.m., n=16, * P=0.0126,*** P=0.0003, ANOVA with Tukey’s multiple comparisons). (L-M) Apoptosis in MV411 (L) and MOLM13 (M) grown in the presence (full media) or absence of glutamine following treatment with AC220 1nM for 48hrs (for MV411 mean ± s.e.m., n=24, for MOLM13 mean ± s.e.m., n=11, **** P<0.0001, *** P=0.0007, two-way ANOVA with Bonferroni’s multiple comparisons). (s.e.m., standard error of mean).

