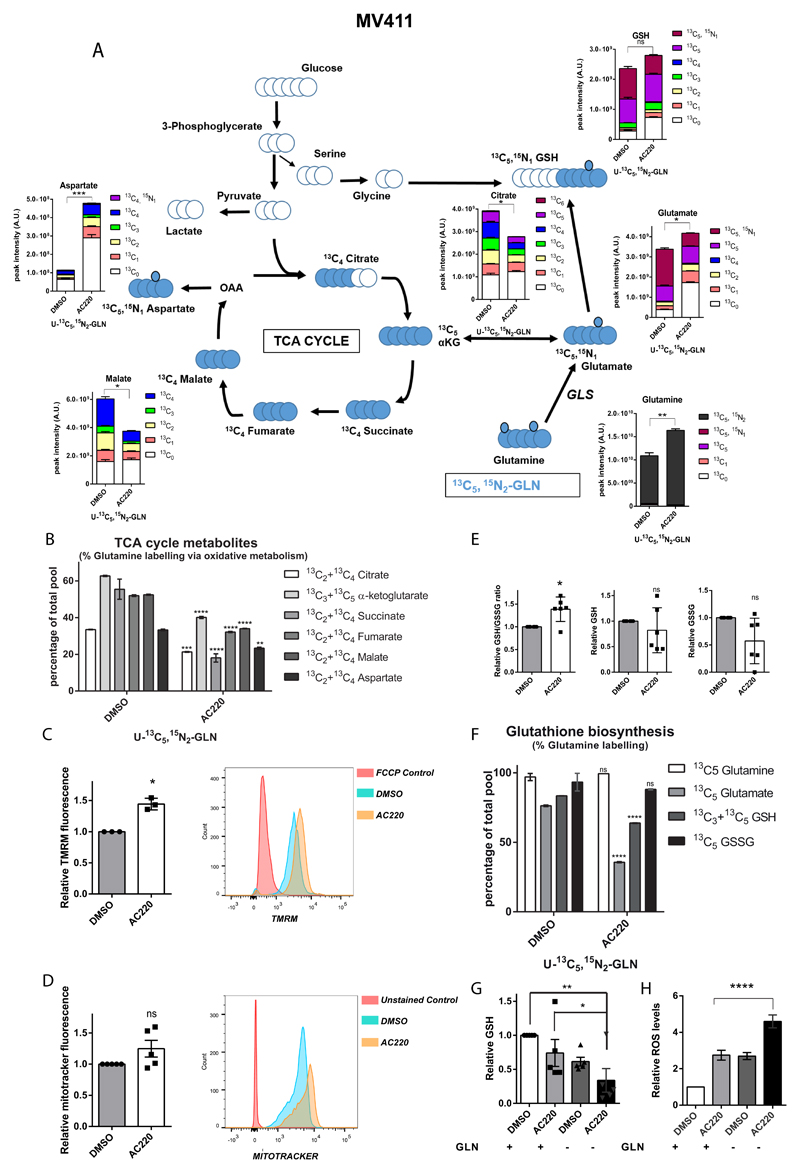
Figure 3. Glutamine supports both mitochondrial function and glutathione production following FLT3 tyrosine kinase inhibition.
(A) Total and isotopologue levels of TCA cycle intermediates, glutamate and reduced glutathione (GSH) measured by LC-MS analysis in MV411 cells treated with AC220 1 nM or vehicle control and grown in media containing U-13C5 and 15Nitrogen [15N2] glutamine (GLN) (mean ± s.e.m., n=5, *** P=0.0005, ** P=0.0017, * P=0.0195 for citrate, P=0.0228 for malate, P=0.0216 for glutamate, ns, not significant, two-tailed paired t-test). A schematic representation of glutamine metabolism and labelling pattern of metabolites by is also provided. (B) Percentage of total levels of TCA cycle metabolites labelled by U-13C5,15N2-GLN through its oxidative metabolism measured by LC-MS analysis in MV411 cells treated with AC220 1 nM or vehicle control (mean ± s.e.m., n=5, **** P<0.0001, *** P=0.0008, ** P=0.0067, two-way ANOVA with Bonferroni’s multiple comparisons). (C) Relative mitochondrial membrane potential of MV411 cells treated with AC220 1 nM or vehicle control (left panel) with representative flow-cytometry histogram (right panel) (mean ± s.e.m., n=3, * P=0.0145, two-tailed paired t-test). (D) Relative mitochondrial mass of MV411 cells treated with AC220 1 nM or vehicle control (left panel) with representative flow-cytometry histogram (right panel) (mean ± s.e.m., n=3, ns, not significant, P=0.13, two-tailed paired t-test). (E) Relative GSH/GSSG ratio, GSH and GSSG of MV411 cells treated with AC220 1 nM or vehicle control (mean ± s.e.m., n=6, * P=0.0173, ns, not significant, two-tailed paired t-test). (F) Percentage of total levels of glutamine, glutamate, GSH and GSSG labelled by U-13C5,15N2-GLN measured by LC-MS analysis in MV411 cells treated as in (A) (mean ± s.e.m., n=5, **** P<0.0001, ns, not significant, two-way ANOVA with Bonferroni’s multiple comparisons. (G) Relative GSH levels of MV411 cells treated with AC220 1 nM or vehicle control in the presence or absence of glutamine (mean ± s.e.m., n=5, ** P=0.0017, * P=0.0471, q=4.248, DF=12, ANOVA with Tukey’s multiple comparisons). (H) Relative cytoplasmic ROS levels of MV411 cells treated with AC220 1 nM or vehicle control in the presence or absence of glutamine (mean ± s.e.m., n=14, **** P<0.0001, ANOVA with Tukey’s multiple comparisons).

