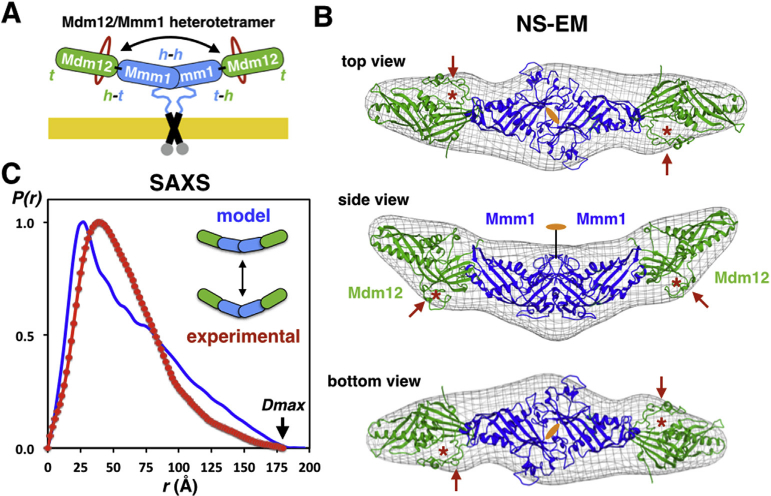
Fig. 4. Pseudo-atomic model of the Sce-Mdm12/Mmm1Δ hetero-tetramer and solution scattering analysis of its average conformation.

(A). Schematic model of the Mdm12/ Mmm1 complex. Insertions in Mdm12 are depicted in red; h and t correspond to the ‘head’ and ‘tail’ regions of each of the four SMP domains, respectively. The ‘head-to-head’ dimer of Mmm1 SMP domains is anchored to the ER membrane. The double arrow highlights the curvature/bent of the complex. (B) Fitting of our Mdm12/Mmm1Δ model using the crystal structure of Sce-Mdm12 in the EM density maps [19]. Red arrows and asterisks indicate the two insertions located next to the ‘head’ in yeast Mdm12. Three views are shown. (C) SAXS analysis of the Sce-Mdm12/Mmm1Δ complex. Comparison of the pair distance distributions determined from experimental scattering data (red) or calculated using our NS-EM/crystallographic mode (blue). (For interpretation of the references to colour in this figure legend, the reader is referred to the web version of this article.)
