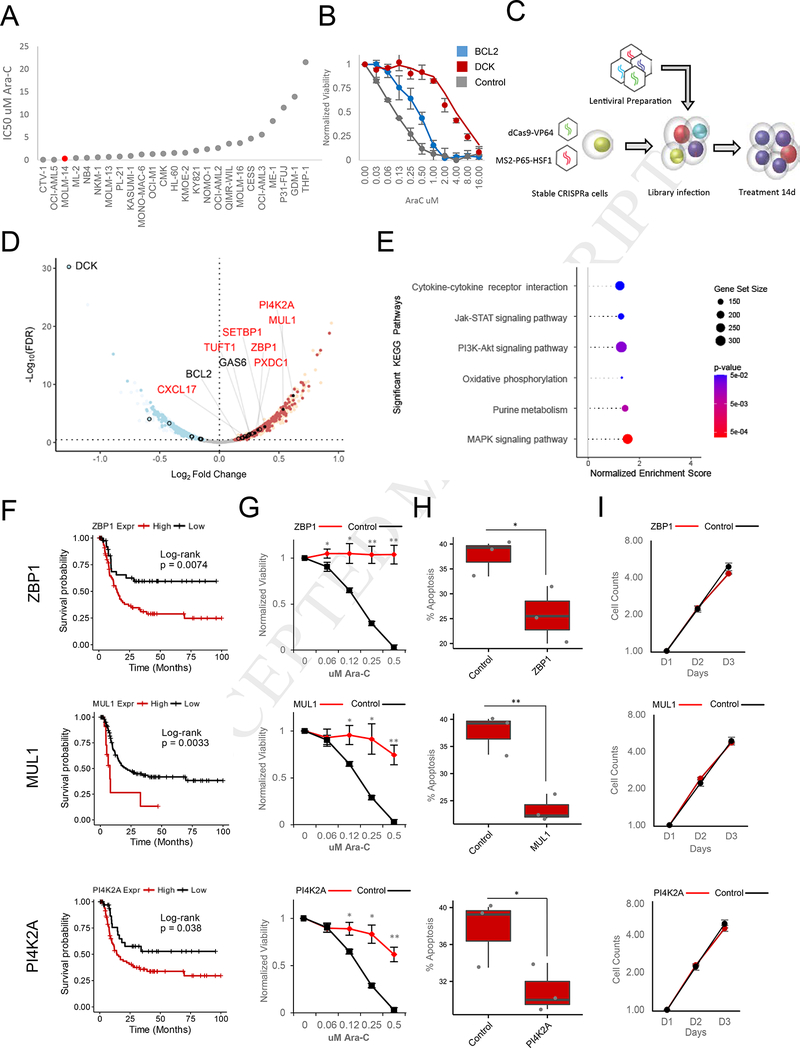
Figure 2. CRISPRa Functional Screening of Coding Genes Modulating Ara-C Response.
(A) Distribution of Ara-C IC50 values across a panel of AML cell lines.
(B) Effect of BCL2 overexpression (Blue) or DCK knockdown on sensitivity to Ara-C in MOLM14 cells. Data are represented as mean ± SD, n = 3.
(C) Schematic of CRISPRa pooled screening for the identification of genes whose activation modulate sensitivity to Ara-C in MOLM14 cells.
(D) Volcano plot summarizing the global changes in sgRNA representation of protein-coding genes before and after 14 days of treatment with Ara-C. A subset of genes validated herein (red text) or previously annotated (black text) to modulate Ara-C sensitivity are labeled. A false discovery rate threshold of 0.339 was determined by receiver operating characteristic analysis (Figure S3F). Red - enrichment in the CRISPRa screening; blue depletion in the CRISPRa screening; open black circles - genes previously associated with differential Ara-C sensitivity and above the significance threshold; filled black points genes validated herein. See also Figure S3C-F, S3H, and Table S4.
(E) Summary of gene set enrichment analysis (GSEA) of protein-coding genes ranked by CRISPRa screening using annotated KEGG (Kyoto Encyclopedia of Genes and Genomes) pathways. See Table S3.
(F) Disease-free survival association with expression levels of ZBP1, MUL1, and PI4K2A, genes enriched in both protein-coding CRISPRa screening and drug sensitivity-gene expression correlation analyses among patients treated with Ara-C therapy within the TCGA-LAML patient cohort. ZBP1: VST expression level cutoff = 6.13 (low, n = 42; high, n = 79), log-rank test: p-value = 0.0074. MUL1: VST expression level cutoff = 9.64 (low, n = 108; high, n = 13), log-rank test: p-value = 0.0033. PI4K2A: VST expression level cutoff = 7.23 (low, 36; high, n = 85), log-rank test: p-value = 0.038.
(G) Ara-C efficacy measurements in MOLM14 cells expressing sgRNAs targeting ZBP1, MUL1, or PI4K2A based on normalized MTS reads following 48 hours of treatment. Data are represented as mean ± SD, n = 3. Welch two sample t-test: *, p < 0.05. **, p < 0.01, ***, p<0.001
(H) Modulation of apoptotic response upon stable expression of sgRNAs targeting ZBP1, MUL1, or PI4K2A in MOLM14 cells. The percentage of apoptosis is determined by annexin V and propidium iodide (PI) staining of cells treated with 0.25 pM Ara-C for 72 hours. Data are represented as mean ± SD, n = 3. Welch two sample t-test: *, p < 0.05. **, p < 0.01, ***, p < 0.001
(I) Proliferation of unchallenged MOLM14 cells expressing sgRNAs targeting ZBP1, MUL1, or PI4K2A. Proliferation is quantified over four days (D1-D4). Data are represented as mean ± SD, n = 3. Welch two sample t-test: *, p < 0.05. **, p < 0.01, ***, p < 0.001

