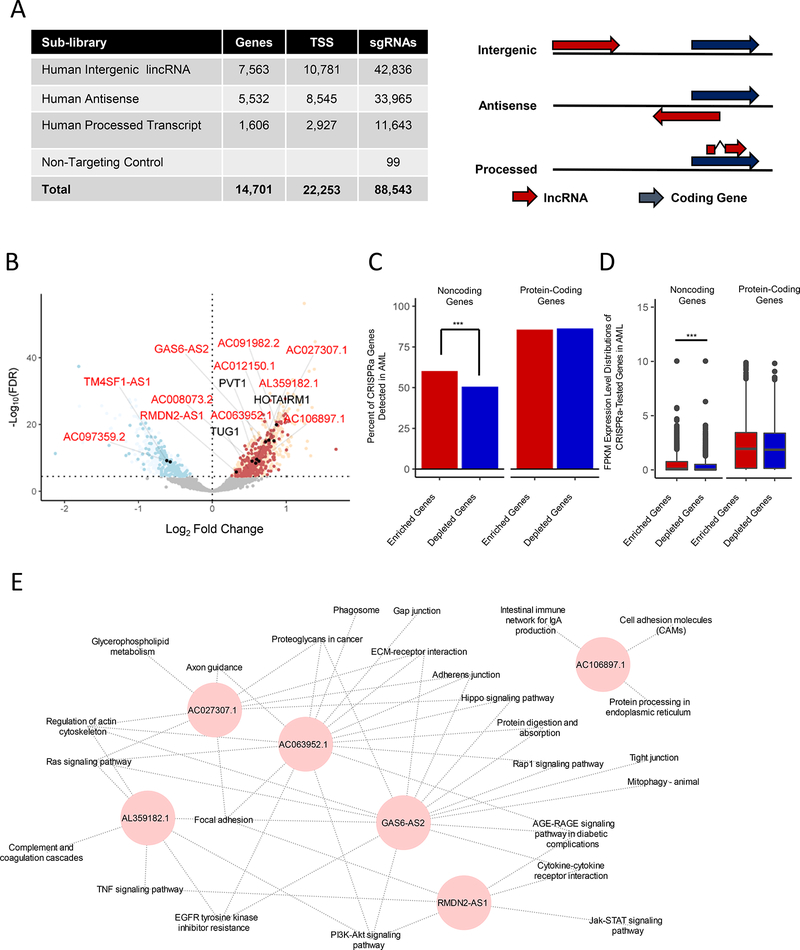
Figure 3. CRISPRa Functional Screening of Noncoding Genes Modulating Ara-C Response.
(A) Left panel: summary of the CaLR library design specifications, including lncRNA gene numbers, transcriptional start sites (TSS), and total sgRNA numbers. Right panel: relationships between coding genes and lncRNA genes for corresponding lncRNA classifications. See also Table S5.
(B) Volcano plot summarizing the global changes in sgRNA representation of noncoding genes before and after 14 days of treatment with Ara-C. A subset of genes either validated herein to modulate Ara-C sensitivity (red text) or previously annotated in various cancer-related pathways (black text) are labeled. A false discovery rate threshold of 3.51e-5 was determined by analysis of nontargeting sgRNA negative controls at the transcript level (Figure S4H). Red points - enrichment in the CRISPRa screening; blue points - depletion in the CRISPRa screening; filled black points - genes validated herein. See also Figure S4E-I and Table S6.
(C) Percentages of significantly enriched or depleted protein-coding or noncoding genes from CRISPRa screens detected in the TCGA-LAML patient samples. Chi-squared test: ***, p = 6.92e-3,
(D) Gene expression level distributions of significantly enriched or depleted protein-coding or noncoding genes from CRISPRa screens detected in the TCGA-LAML patient samples. Wilcoxon rank-sum test: ***, p = 5.4e-7.
(E) Guilt-by-association pathway annotation of enriched genes identified in the CaLR screen. KEGG pathway gene sets were used for this analysis.

