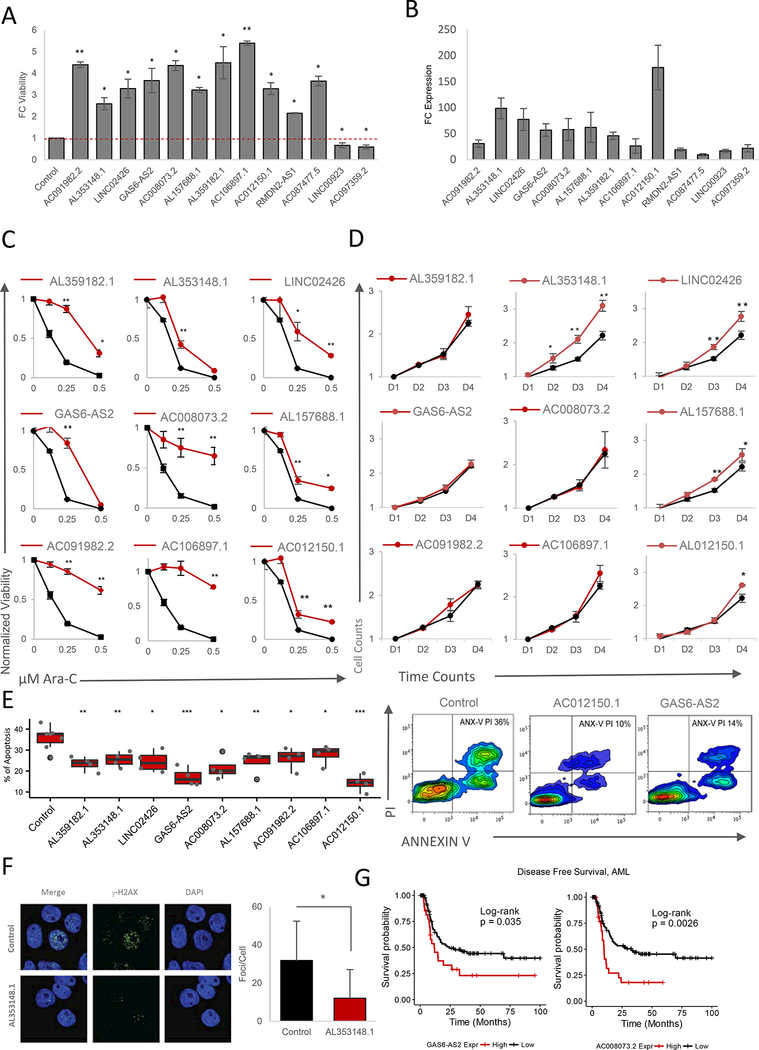
Figure 4. Validation of CaLR Screening Results.
(A) Fold change (FC) of MOLM14 cell viability treated with 0.25 pM Ara-C for 48 hours. Data are represented as mean ± SD, n = 3. Welch two sample t-test: *, p < 0.05. **, p < 0.01,***, p < 0.001.
(B) Fold change (FC) of expression levels of targeted lncRNAs upon overexpression of enriched sgRNAs versus endogenous levels. Data are represented as mean ± SD, n = 3.
(C) Ara-C efficacy measurements in MOLM14 cells expressing sgRNAs targeting indicating genes based on normalized MTS reads following 48 hours of treatment with the indicated concentrations of Ara-C. Data are represented as mean ± SD, n = 3, Welch two sample t-test: *, p < 0.05. **, p < 0.01, ***, p < 0.001
(D) Proliferation of unchallenged MOLM14 cells expressing sgRNAs targeting indicating genes. Proliferation is quantified over four days (D1-D4). Data are represented as mean ± SD, n = 3. Welch two sample t-test: *, p < 0.05. **, p < 0.01, ***, p < 0.001.
(E) Left panel: modulation of apoptotic response upon stable expression of sgRNAs targeting a panel of significantly enriched sgRNAs as determined through CaLR screening in MOLM14 cells. The percentage of apoptosis is determined by annexin V and propidium iodide (PI) staining of MOLM14 cells stably infected with individual sgRNAs and treated with 0.25 pM Ara-C for 72 hours. Data are represented as mean ± SD, n = 3. Welch two sample t-test: *, p < 0.05. **, p < 0.01, ***, p < 0.001. Right panel: representative flow cytometry plots of annexin V/PI staining intensities corresponding to two sgRNAs promoting survival versus nontargeting control.
(F) Immunofluroscence images (left panel) for DAPI and phospho-YH2A.X staining in MOLM14 cells stably infected with sgRNAs targeting the lncRNA genes shown, and treated with 25 pM Ara-C for 24 hours. Staining is quantified in the right panel. Data are represented as mean ± SD, n = 3. Welch two sample t-test: *, p < 0.05. **, p < 0.01, ***, p < 0.001.
(G) Disease-free survival association with expression levels of GAS6-AS2 and AC008073.2, genes enriched in both noncoding CRISPRa screening and drug resistance-gene expression correlation analyses among patients treated with Ara-C therapy within the TCGA-LAML patient cohort. GAS6-AS2: VST expression level cutoff = 3.38 (low, n = 92; high, n = 29), log-rank test: p-value = 0.035. AC008073.2: VST expression level cutoff = 4.39 (low, n = 93; high, n = 28), log-rank test: p-value = 0.0026.

