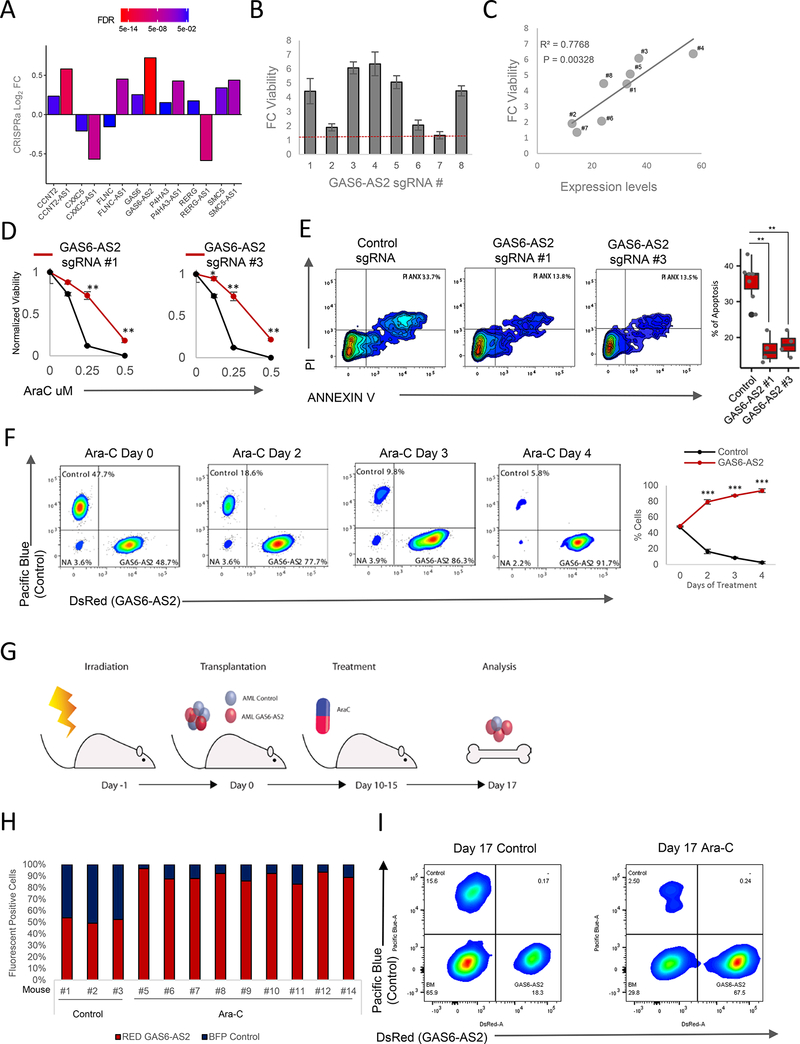
Figure 5. GAS6-AS2 Promotes Drug Resistance In Vitro and In Vivo.
(A) Integration of drug resistance-gene expression correlative analysis and forward genetic screenings identifies seven sense-antisense gene pairs which pass all significance thresholds, a higher number than expected by chance alone (Chi-squared test: p = 9.85e-7).
(B) Fold change (FC) of MOLM14 cell viability treated with 0.25 pM Ara-C for 48 hours. Cells expressing individual sgRNAs targeting GAS6-AS2. Data are represented as mean ± SD, n = 3. Welch two sample t-test: *, p < 0.05. **, p < 0.01, ***, p < 0.001.
(C) Pearson correlation between cell viability versus GAS6-AS2 expression level for each of the 8 sgRNAs targeting GAS6-AS2.
(D) Ara-C efficacy measurements in MOLM14 cells expressing sgRNAs #1 and #3 targeting GAS6-AS2 based on normalized MTS reads following 48 hours of treatment. Data are represented as mean ± SD, n = 3. Welch two sample t-test: *, p < 0.05. **, p < 0.01, ***, p < 0.001.
(E) Left panel: representative flow cytometry data of MOLM14 cells expressing either control or GAS6-AS2-targeting sgRNAs, treated with 25 pM Ara-C for 24 hours and labeled with viability (propidium iodide (PI)) and apoptotic (annexin V) markers. Right panel percentage of apoptosis determined from quantification of staining results. Data are represented as mean ± SD, n > 3, Welch two sample t-test: *, p < 0.05. **, p < 0.01, ***, p < 0.001.
(F) Competition assay between populations of MOLM14 control-Blue and MOLM14 GAS6- AS2-Red following 25 pM Ara-C treatment. Left panels: representative flow cytometry plots. Right panel: ratios between red and blue cells over time. Data are represented as mean ± SD, n > 3. Welch two sample t-test: *, p < 0.05. **, p < 0.01, ***, p < 0.001.
(G) Schematic of an orthotopic xenograft competition assay between control (blue) and GAS6-AS2 (Red) MOLM14 cells with Ara-C treatment.
(H) Ratios of control (blue) versus GAS6-AS2 (Red) MOLM14 cells from bone marrow of mice treated and analyzed at day 17 as outlined in Figure 5G.
(I) Representative flow cytometry results of cells harvested from mouse bone marrow 17 days following transplantation and treatment with vehicle or Ara-C for 5 days.

