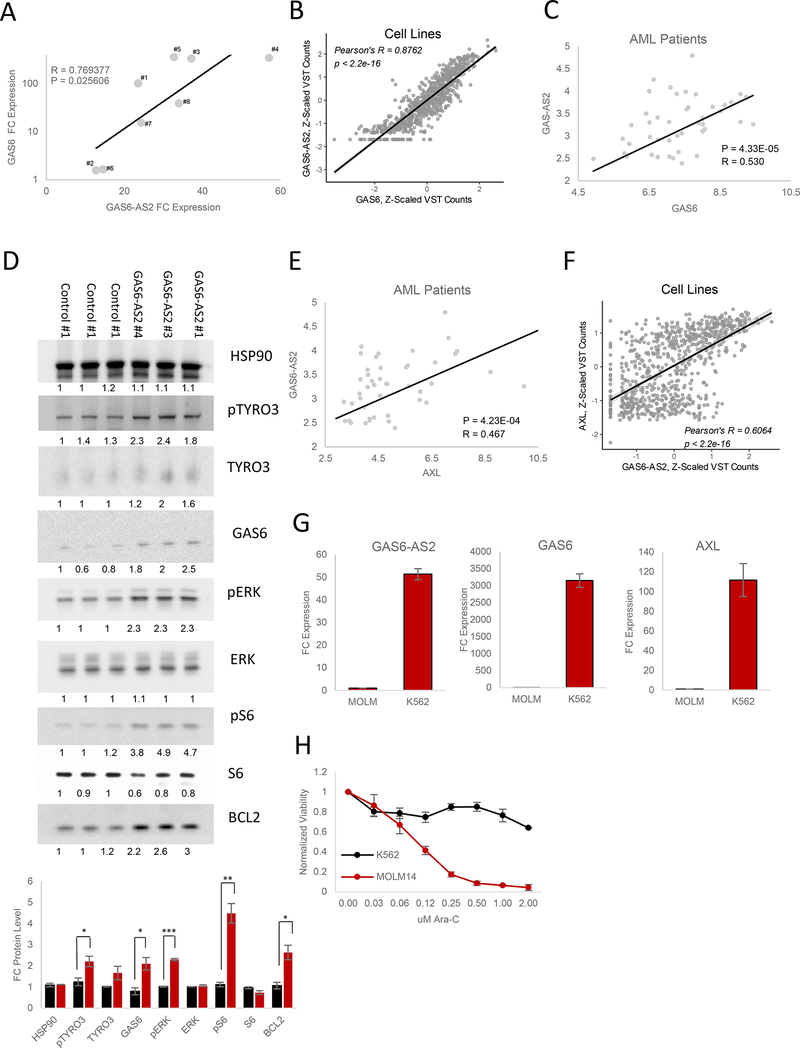
Figure 6. GAS6-AS2 Activates GAS6/TAM Signaling.
(A) Pearson correlation between GAS6-AS2 and GAS6 expression levels following GAS6- AS2 activation. Data are represented as mean of triplicate measurements.
(B) Pearson correlation between GAS6-AS2 and GAS6 expression levels across the 760 cancer cell lines analyzed (Figure 1A-B).
(C) Pearson correlation between GAS6-AS2 and GAS6 expression levels in AML patient samples.
(D) Western blot analysis of differential GAS6/TAM signaling activation in response to individual control or GAS6-AS2 sgRNA overexpression.
(E) Pearson correlation between GAS6-AS2 and AXL expression levels in AML patient samples.
(F) Pearson correlation between GAS6-AS2 and AXL expression levels across the 760 cancer cell lines analyzed (Figure 1A-B).
(G) Expression levels of GAS6-AS2, GAS6, and AXL in MOLM14 and K562 cell lines.
(H) Ara-C efficacy measurements in MOLM14 and K562 cell lines, based on normalized MTS reads following 48 hours of treatment with the indicated concentrations of Ara-C. Data are represented as mean ± SD, n = 3.

