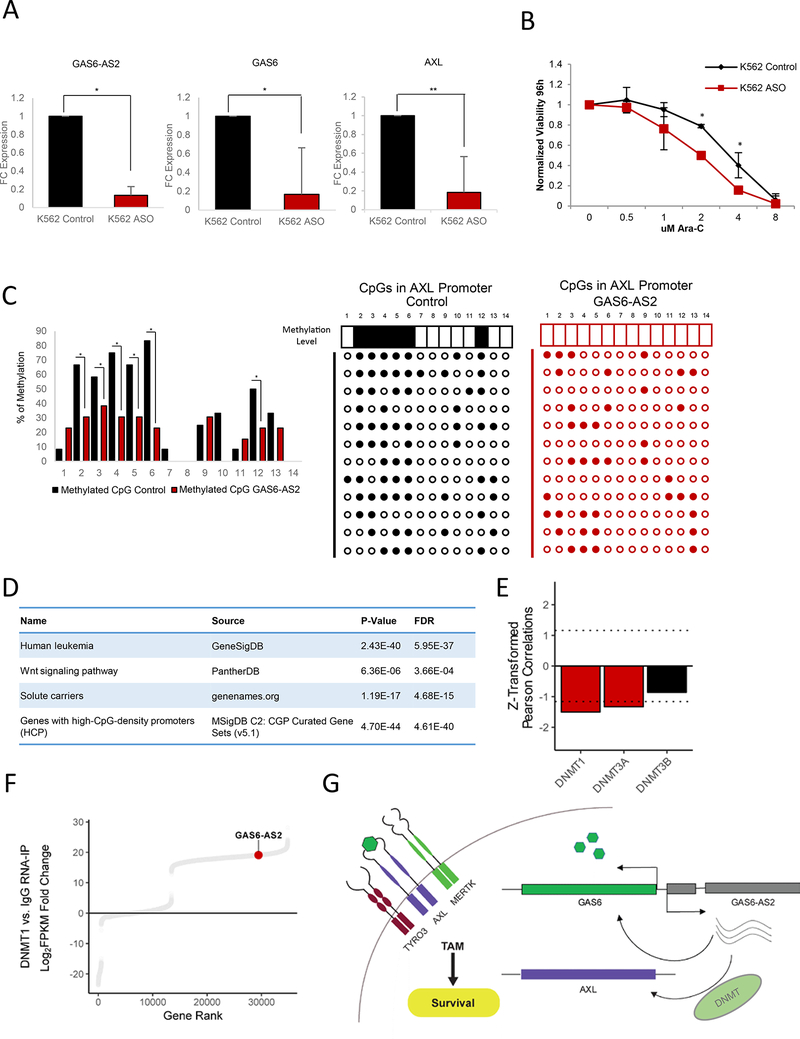
Figure 7. GAS6-AS2 Demonstrates Trans-Regulation of AXL.
(A) Fold change (FC) of GAS6-AS2, GAS6, and AXL in response to GAS6-AS2 knockdown via ASO in K562 cells. Data are represented as mean ± SD, n = 3. Welch two sample t- test: *, p < 0.05. **, p < 0.01, ***, p < 0.001.
(B) Modulation of Ara-C response upon GAS6-AS2 knockdown via ASO in K562 cells. Data are represented as mean ± SD, n = 3, Welch two sample t-test: *, p < 0.05. **, p < 0.01,***, p < 0.001.
(C) Methylation of CpG islands in the HEK293T AXL promoter following modulation of GAS6-AS2 expression. n = 12, Chi-square test: *, p < 0.05. **, p < 0.01, ***, p < 0.001.
(D) Gene ontology analysis of coding genes clustered with GAS6-AS2 as determined by k- means clustering (cluster #6 in Figure S7D).
(E) Drug sensitivity-gene expression Pearson correlation values of DNA methyltransferases. Genes enriched beyond a Z-score threshold of ± 1.16 are colored in red. See also Figure 1B.
(F) Distribution of FPKM-normalized transcript abundances associated with DNMT1 versus IgG.
(G) Model summarizing the mechanism by which GAS6-AS2 regulates GAS6/TAM signaling.

