Figure 3.

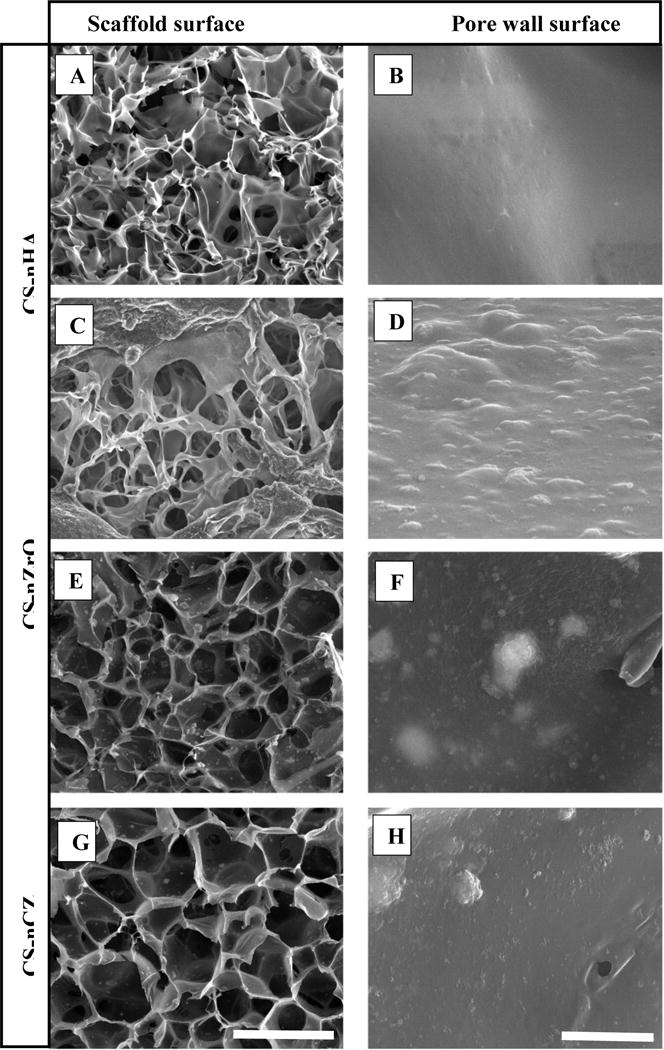
SEM images showing the highly porous morphology of scaffold surface (A, C, E, and G) and magnified image showing the surface of scaffold wall (B, D, F, and H). (Scale: 100 μm for scaffold surface and 2 μm for pore wall surface).

SEM images showing the highly porous morphology of scaffold surface (A, C, E, and G) and magnified image showing the surface of scaffold wall (B, D, F, and H). (Scale: 100 μm for scaffold surface and 2 μm for pore wall surface).