. 2016 Jun 20;5(5):1400–1409. doi: 10.1039/c6tx00047a

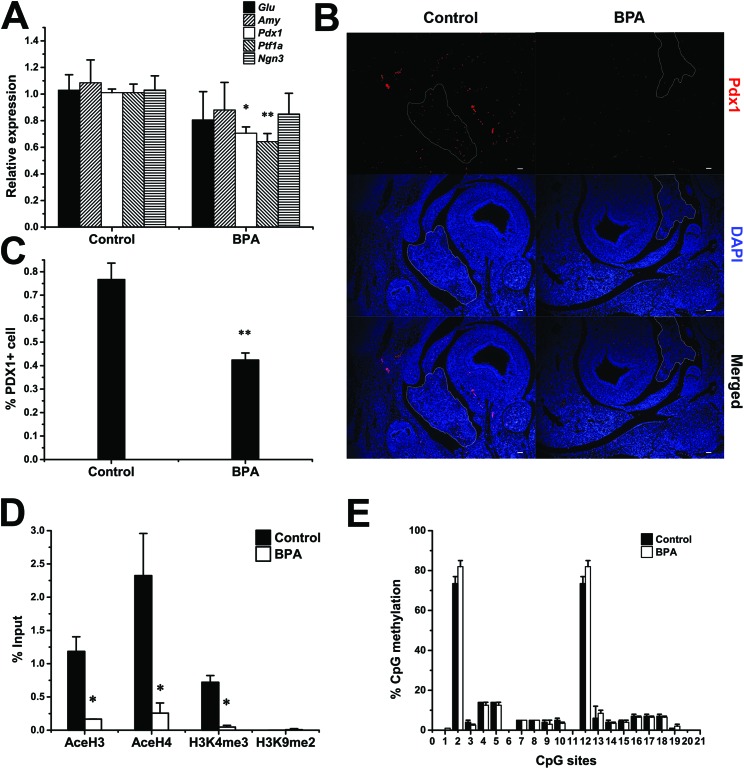
Fig. 3. The expression and epigenetic profiling of Pdx1 at GD 15.5. (A) The expression level of mRNA for Pdx1 was determined at GD 15.5 (n = 6). (B) PDX1+ cell was stained red with the anti-PDX1 antibody and the pancreas at GD 15.5 was outlined (n = 6). Bars = 50 μm. (C) PDX1+ cell fraction at GD 15.5 (n = 6). (D) The abundance of AceH3, AceH4, H3K4me3, and H3K9me2 at the Pdx1 promoter (n = 3). Data are represented as percent of input control, which undergo analyses exactly as the test samples except for the IP step. (E) DNA methylation status at the Pdx1 promoter (n = 3). Data are represented as mean ± SEM. *p < 0.05, **p < 0.01 by two-tailed Student's t-test.

Fig. 3