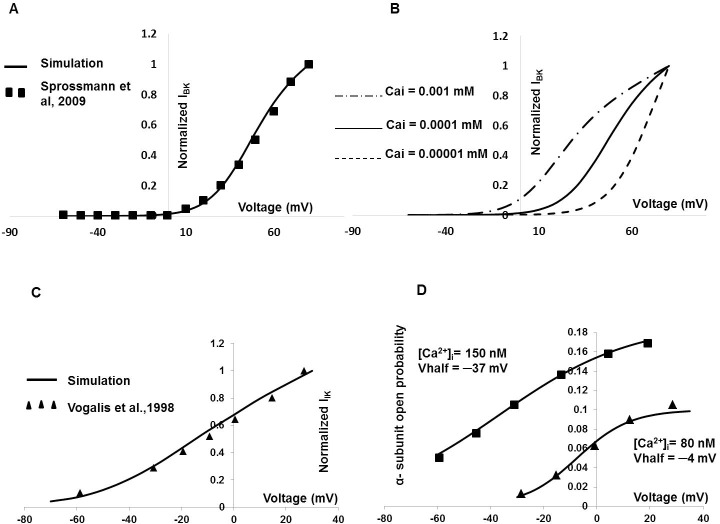
Fig 4. DSM IBK and IIK model.
(A) DSM cell IBK model. Fig 4A represents the normalized simulated current-voltage curve (solid line), where experimental data from murine DSM cell [80] are superimposed in filled square. Fig 4B represents the effects of intracellular Ca2+ concentration on shifting the current-voltage curve. The [Ca2+]i is varied from the control value of 0.0001 mM (solid line) to 0.00001 mM (dashed line) and 0.001 mM (dot and dash line). (C) The solid line represents the normalized simulated IIK current-voltage curve, where experimental data from mouse intestinal cell [81] are superimposed in filled triangle. (D) It represents open probability of α-subunits with respect to varying [Ca2+]i in IIK model.

