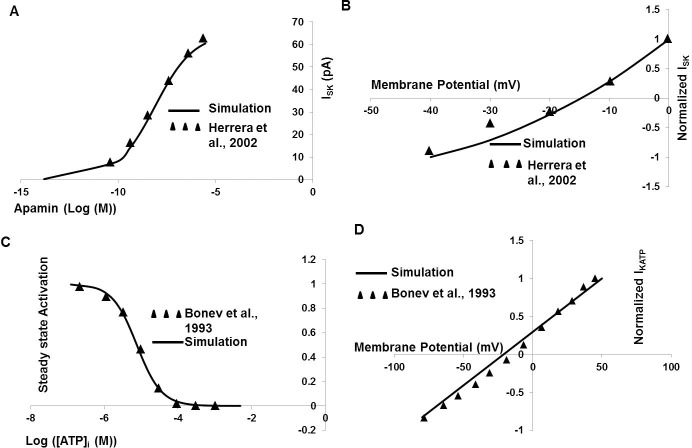
Fig 5. DSM ISK and KATP model.
(A) The normalized ISK current with respect to Apamin in ISK model. (B) The solid line represents the normalized simulated ISK current-voltage curve, where experimental data from murine DSM cell [40] are superimposed (filled triangle). (C) The ATP dependent steady state activation parameter for KATP channel model. (D) The normalized KATP current-voltage relationship curve. The solid line represents result from our simulation where filled triangles are superimposed data from experiment [90].

