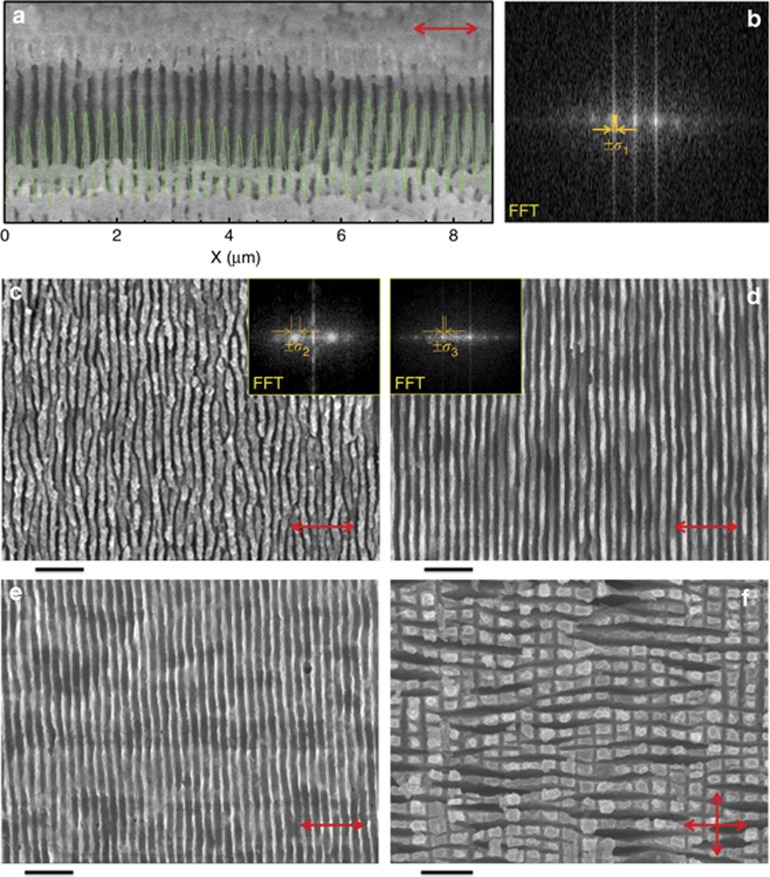
Figure 3.
The deep sub-wavelength period ripples on a dielectric surface. SEM images of ripples on ZnS made by 500 pulse irradiation using the cylindrical lens focusing without scanning. (a) The profile line shows ripples’ continuity; (b) the FFT image (right) shows the period and the standard deviation, ±σ. Ripples recorded at the lower scan velocities had better defined period: υs=5 μm s−1 (c) and υs=0.2 μm s−1 (d). Insets c and d show FFT images corresponding to Λ=207±10 nm c and 212±25 nm d; the error ±σ margins are shown. (e) Effect of mild etching in H2SO4 (pH≈1) solution for 10 min of the pattern shown in d. (f) Two-dimensional pattern of ripples obtained by criss-cross scanning. Irradiation conditions were: pulse intensity on sample Ip=6.67 TW cm−2, wavelength of 800 nm, pulse duration of 150 fs, a cylindrical focusing, E-field was polarized perpendicular to the scan. A slight change of period for two directions is caused by an effective decrease of refractive index of the surface after the first ripples’ pattern was recorded. Scale bars c–f denote 1 μm; linear polarization is marker by arrow.

