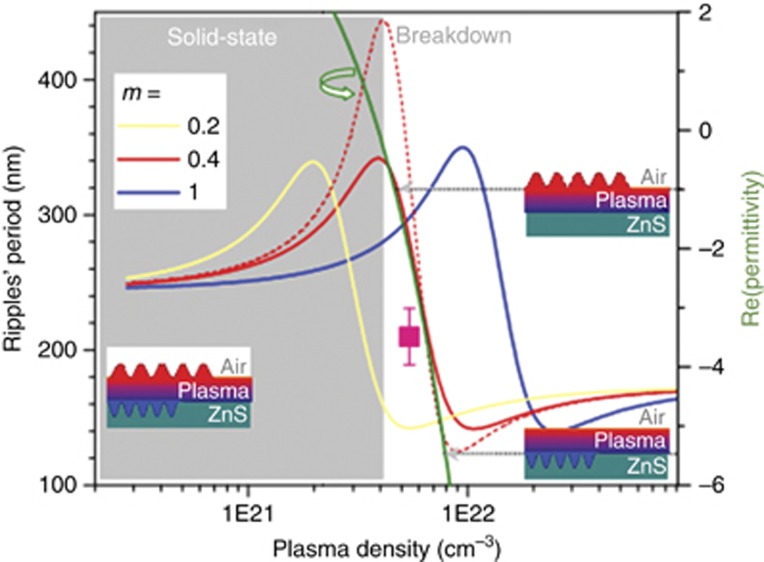
Figure 4.
Plasmonic excitation on the sub-surface plasma substrate boundary. The period of standing plasmon wave is equal to the half of the ripples’ period, Λ=λs/2 plotted for different plasma densities Ne, effective mass of electrons m*=m × me, and relaxation time of τD=3 fs close to an optical cycle (see Materials and Methods section and Supplementary Information for details). The right-side axis shows Re(ε*) dependence on Ne with horizontal arrows indicating surface wave condition at different interfaces Re(ε*)<−n2 (pictorial markers); breakdown plasma at Re(ε*)=0. The experimental point corresponding to the excitation conditions shown in Figure 3 are is presented by square marker. Note, the plasma density is calculated by Equation (1) with electron mass m=1 and vacuum wavelength λ. The period (left axis) is calculated for the plasma–substrate interface; periods on the air–plasma interface; periods on the air–plasma interface are considerably larger and are not shown.

