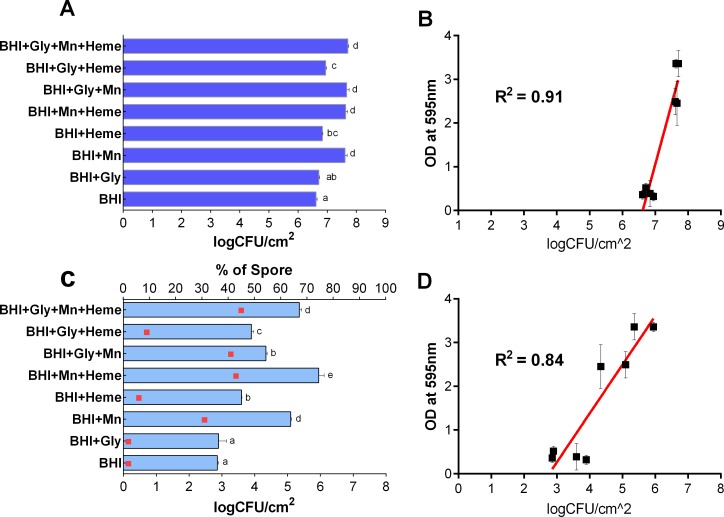
Fig 2. Number of cells and spores in B. cereus biofilms.
B. cereus GIHE 72–5 was grown in BHI supplemented with glycerol with or without Mn2+ and heme at 30°C for 48 h. Number of cells in logCFU/cm2 (A); scatter plot showing the relationship between the number of cells and the results of crystal violet assays (B); number of spores in logCFU/cm2 (C); scatter plot showing the relationship between spore formation and the results of crystal violet assays (D). While, squares (C) show the percentage of spore formation compared to the number of cells in biofilms. Each data point represents the average value obtained in three biological experiments, and the standard deviation. To compare the number of cells and spores obtained among the conditions used, one-way ANOVA and Tukey's post hoc test (p < 0.05) were performed. Groups marked with different letters in each growth condition display significant differences.

