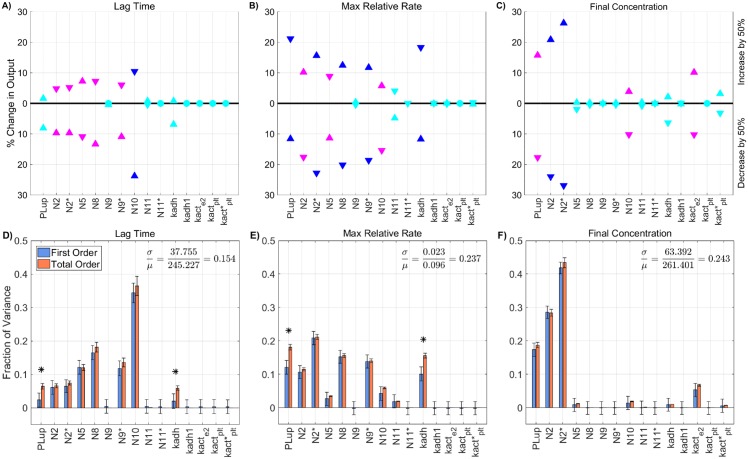
Fig 8. Sensitivity of thrombin generation to platelet characteristics.
Variation in the A,D) lag time; B,E) maximum relative rate; C,F) final concentration; to platelet characteristics using the local (OAT) method (A-C) and global Sobol method (D-F). Local: Sensitivities that lie between 0.75 and 1 (blue), between 0.25 and 0.75 (magenta), less than 0.25 (cyan) determine the rank-ordered list of platelet characteristics. The percent change of thrombin generation measures from standard model output for each initial condition are represented by triangles. The direction of variation is indicated with an upwards or downwards facing triangle. Global: First and Total Order Sobol indices are plotted as bars with errors of 2 standard deviation about the mean, computed with 5,000 bootstrap samples of the original 170,000 function evaluations. The coefficient of variation is included to provide a scale for the fraction of variance. PCs with Total Order index statistically significantly larger than the First order index are indicated with a star.

