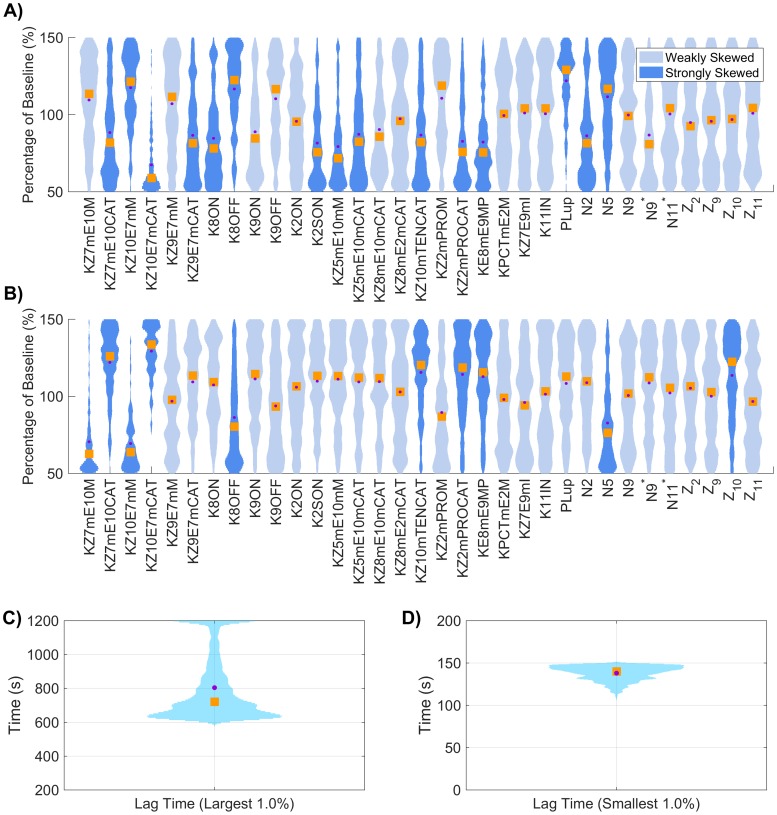
Fig 12. Conditional input distributions for globally varied subset of all parameters, of thrombin lag time and final concentration.
The subset of parameters were sampled uniformly between 50-150% of their baseline value and the lag time of total thrombin was computed. The input distributions were conditioned on a slow burst: the largest 1% of lag time (A) and a fast burst: the smallest 1% of lag time (B). Distributions were colored dark blue if the empirical skew was greater than 0.5 in magnitude and light blue otherwise. Distributions of lag times for slow bursts (C) and fast bursts (D); skew shown when the mean (dot) and median (square) are not aligned.

