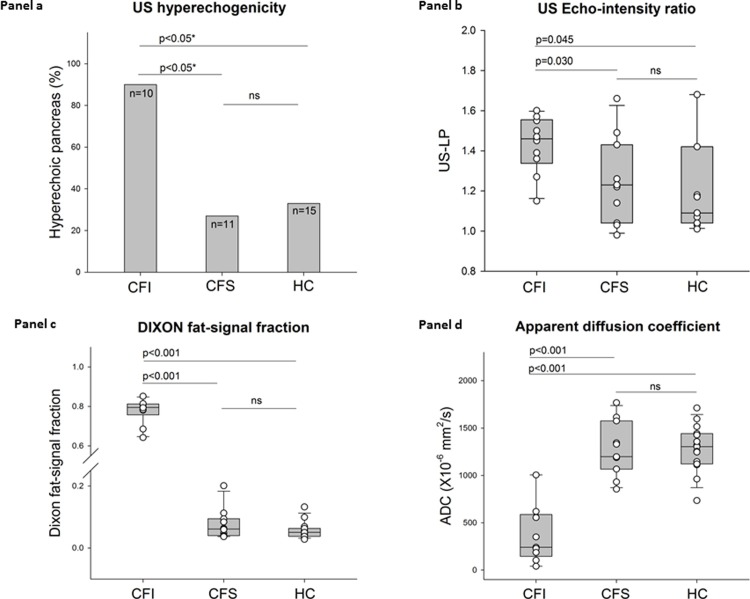
Fig 3. Panel a displays percentage of subjects with a hyperechoic pancreas in CFI patients, CFS patients and HCs.
Panel b displays box and scatterplots for the US liver/pancreas echo-intensity ratios (US-LP) in the three groups. Panel c displays box and scatterplots for the MRI-Dixon fat-signal fraction in the three groups. Panel d displays box and scatterplots for ADC in the three groups. CFI: Pancreas insufficient cystic fibrosis, CFS: Pancreas sufficient cystic fibrosis, HC: Healthy control. US: Ultrasonography. US-LP: Ultrasound liver-pancreas signal intensity ratio. ADC: Apparent diffusion coefficient. ns: Not significant. (*Pearson chi-square test).

