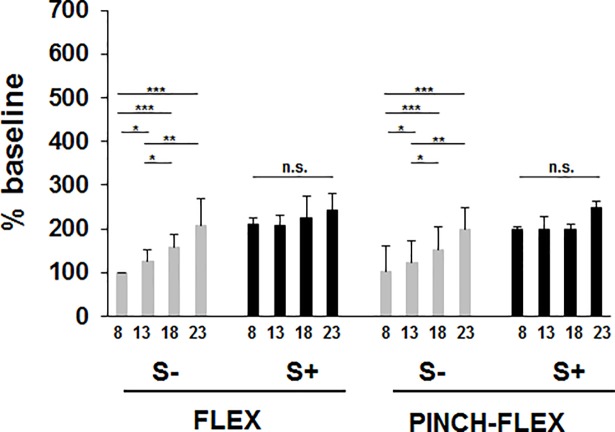
Fig 5. Biceps brachii response amplitudes for trials with startle signs (S+), and trials without startle signs (S-) in FLEX and PINCH-FLEX tasks for the four analyzed stimulus intensities (multiples of sensory threshold, ST: 8×ST, 13×ST, 18×ST, 23×ST).
Bars correspond to mean (± SD) values for all subjects. Asterisks above the bars define the level of significance for group comparisons: * = P < 0.05, ** = P < 0.01, *** = P < 0.001.

