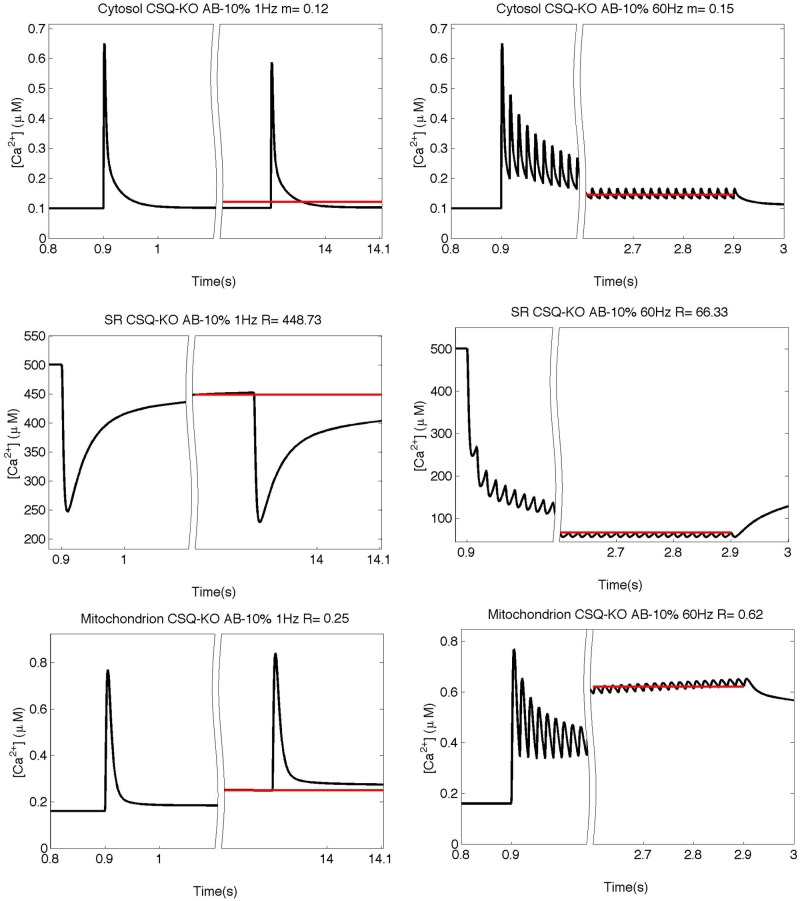
Fig 5. Simulation of the free calcium concentrations in CSQ-KO with an AB buffering capacity of 10% of that of CSQ.
Simulation of the free calcium concentrations in the three compartments at 1 and 60 Hz as predicted by the model without CSQ (CSQ-KO) with a AB buffering capacity of 10% of that of CSQ and with doubled Pmax value. Red lines represent the mean value (“m” for the cytosolic space) or the steady value before the beginning of the next stimulus (“s” in SR and mitochondrion). Above each panel the values for m or s are reported.

