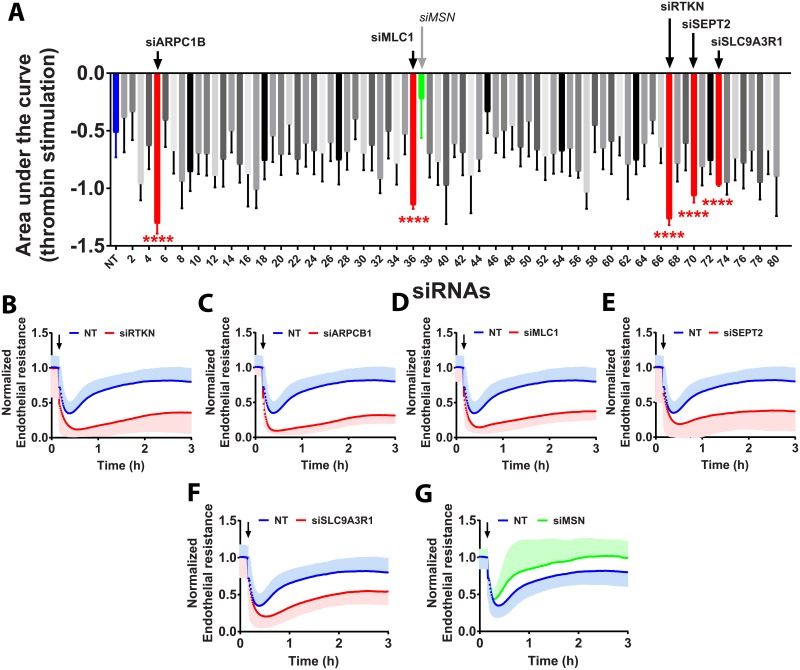
Fig 4. Contribution of Rho effector proteins and associated proteins to the response to thrombin.
A—Quantification of the area under the response curve (AUC) of HUVECs transfected with 80 different siRNAs targeting Rho-effector proteins (and associated genes) stimulated with 1U/ml of thrombin for 3h at 72h post-transfection (n = 3±SD). In blue, on the left, NT control siRNA (n = 18, in triplicate), in red Rho-effector proteins with a significantly different AUC compared to NT control siRNA and in green, siMLC1. (Color code refers to the change in AUC, see S1A–S1C Fig) ****P<0.0001 in two-tailed Student’s T-test and FDR<0.05; B-G—Normalized endothelial resistance of HUVECs transfected with the indicated siRNAs and stimulated with 1U/ml of thrombin for 3h at 72h post-transfection (n = 3±SD); Arrow indicates the moment at which thrombin was added.

