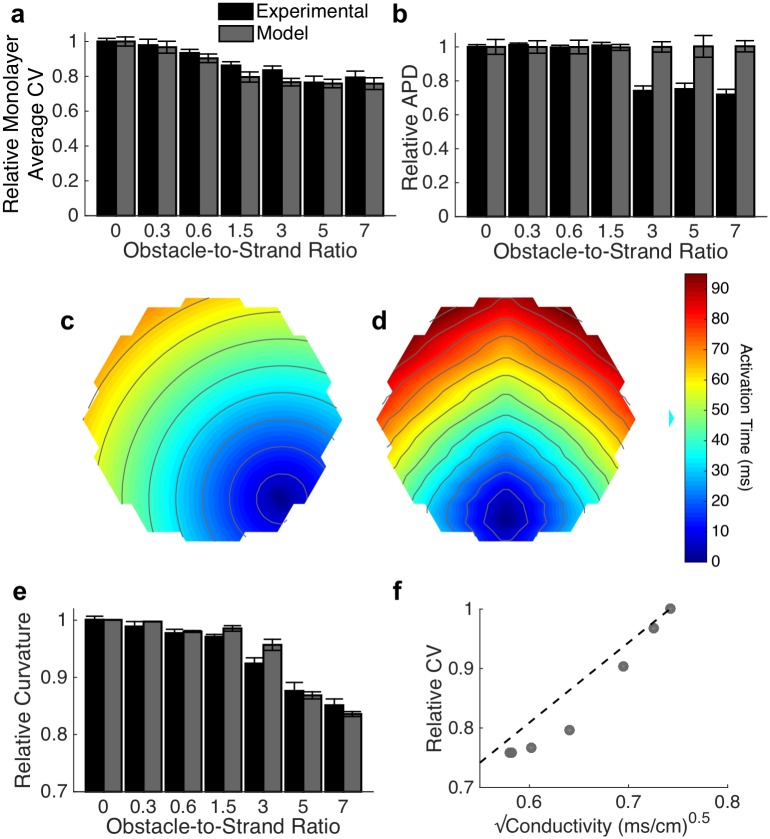
Fig 3. Simulated conduction in microheterogeneous tissues.
(a-b) The monodomain biophysical model is able to replicate experimentally observed conduction slowing (a; mean ± se) at increasing obstacle-to-strand ratios, but does not recapitulate the experimentally observed decreased in action potential duration (b; mean ± se). (c-e) Activation isochrones curvatures are qualitatively (c-d for obstacle-to-strand ratios of 0 (c) and 7.0 (d)) and quantitatively (e; mean ± sd) similar to those seen experimentally (Fig 2). Activation isochrone lines at 8 ms spacing (f) Changes in conduction velocity are not completely by the classical square-root relationship between effective electrical conductivity and velocity (R2 = 0.86).

