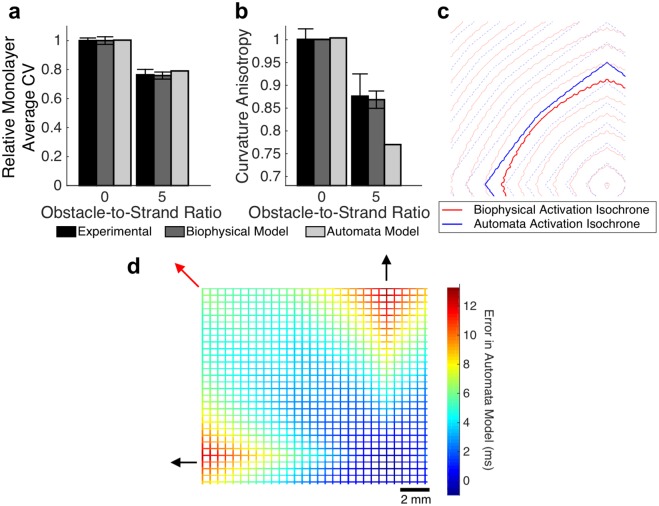
Fig 4. Path tortuosity does not fully explain heterogeneity-induced conduction slowing.
(a-b) The automata model, which considers only conduction path length and does not reflect microscopic conduction variation, approximately captures macroscopic conduction velocity (a; mean ± se) but exhibits substantially more curvature anisotropy compared to experimental monolayers and the biophysical model (b; mean ± sd). (c) Activation isochrones are overlaid to highlight the difference in shape between the biophysical model (red) and the automata model (blue). (d). Error in the automata model, compared to the biophysical model, is highest along the principal axes of conductions (black arrows), and lowest along the bisecting diagonal (red arrow), suggesting spatial variation in microscale conduction velocity.

