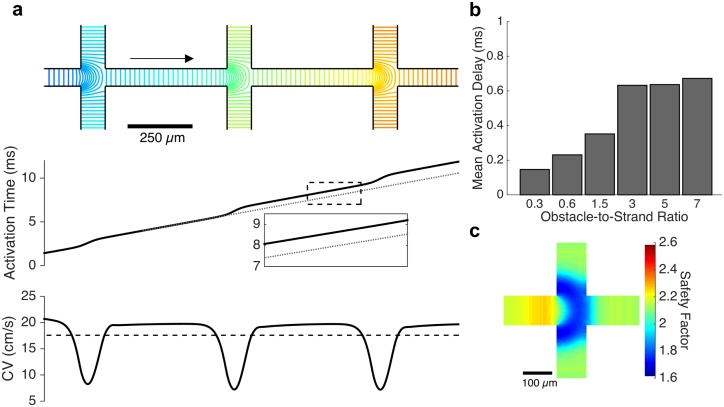
Fig 5. Conduction slowing at branching points.
(a) As the wavefront travels from right to left (direction of arrow) along the principal axis of conduction (obstacle-to-strand ratio: 5), activation isochrones reveal significant slowing at each branching point (top and bottom panels). An up to 36.6% decrease in local conduction velocity leads to a conduction delay across the branch point (middle panel) and a net 11.8% reduction in mean CV along the strand (bottom panel, dashed). (b) The magnitude of the conduction delay at each branching point is correlated with the obstacle-to-strand ratio of the tissue. (c). A significant decrease in safety factor of conduction is observed at each branch point, indicating that a mismatch of electrical source and load is responsible for the conduction delay.

