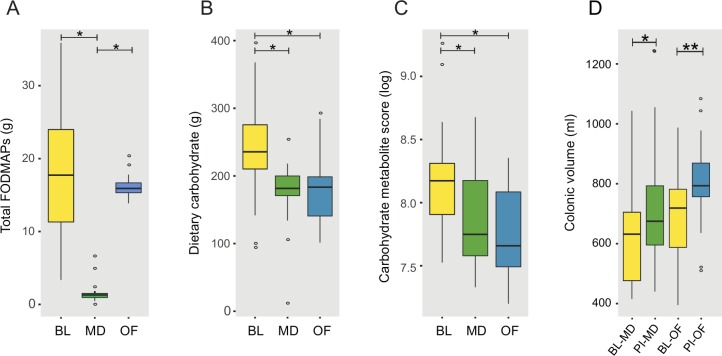
Fig 3. Changes in carbohydrate intake, metabolites and colonic volume.
A) Mean daily FODMAP intake (g), including oligofructose supplementation. B) Mean daily carbohydrate intake (g), C) Aggregate metabolite score for ‘Carbohydrates and carbohydrate conjugates’, D) Change in colonic volume post-intervention; BL = baseline, PI = post-intervention, OF = oligofructose group, MD = maltodextrin group. * p < 0.05.

