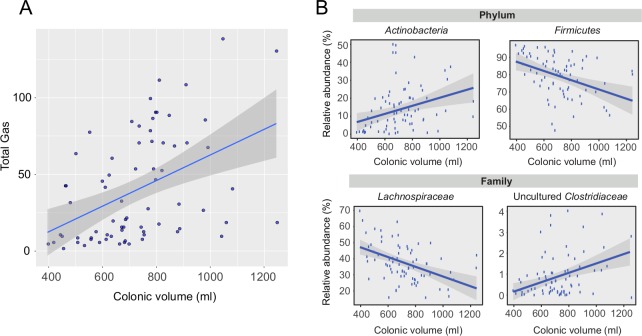
Fig 6. Colonic volume and associations with breath gas and microbiota.
A) Correlation between colonic volume and total breath gases (hydrogen and methane, ppm) at both time points (rho = 0.51, p < 1 x 10⁻⁵); Associations between colonic volume and the microbiota on B) phylum-level and C) family-level over both time points. BL = baseline, PI = post-intervention, OF = oligofructose, MD = maltodextrin.

