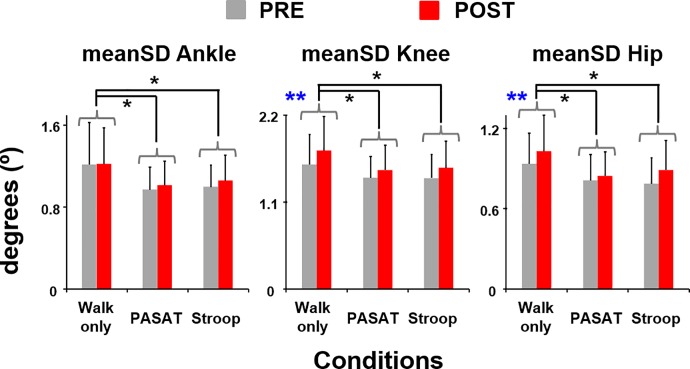
Fig 4. Mean standard deviation (meanSD) of the lower-limb joint motions.
meanSD of ankle, knee, and hip joint angles before (PRE, grey bars) and after (POST, red bars) the exercise session. Error bars represent 1 STD. ** indicates significant difference between the PRE and POST. * indicates significant difference from the walking only condition (THSD, p<0.05).

