. 2016 Oct 3;5(6):1680–1687. doi: 10.1039/c6tx00201c

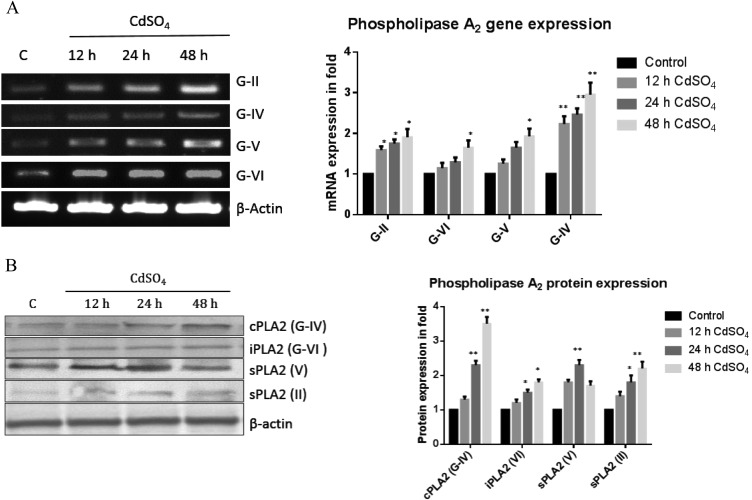
Fig. 3. Transcription and translation levels of phospholipase A2. (A) Total RNA was isolated using Trizol reagent and cDNA was constructed using Reverse Transcriptase. Rat phospholipase genes (G-II, IV, V, and VI) were amplified using specific primer sequences. The expression ratio of the specific genes/actin under control conditions was taken as one. (B) The protein expression was studied for the phospholipases A2 (cPLA2, iPLA2, sPLA2 (II)) and sPLA2 (IV) using a specific primary antibody (1 : 500). The band intensity was measured by the Image one software. The data shown were mean ± SD from six independent experiments each conducted in triplicates. Control cells were compared with other groups with a statistical significance of *p < 0.05 and **p < 0.01.

Fig. 3