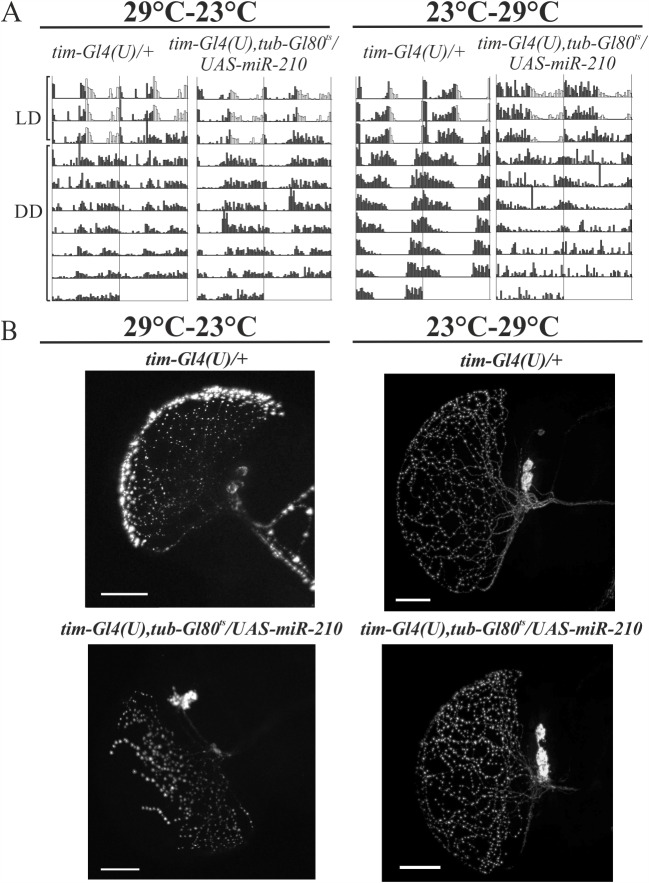
Fig 9. Temporal expression of miR-210 in clock cells.
(A) Double-plotted locomotor activity of a single representative fly per genotype, recorded for 3 complete days under LD and for 7 complete days under DD. The indicated temperatures refer to tim-Gl4(U),tub-Gl80ts/UAS-miR-210 flies and controls (tim-Gl4U)/+) developed at 29°C and analysed at 23°C (29°C-23°C) or developed at 23°C and analysed at 29°C (23°C-29°C). (dark grey: dark phase; white: light phase). (B) Confocal stack images representing l-LNvs arborisation patterns in flies over-expressing miR-210 during different temporal transects (see above). Whole brains were collected at ZT0 and PDF was detected. Scale bar: 25 μm.

