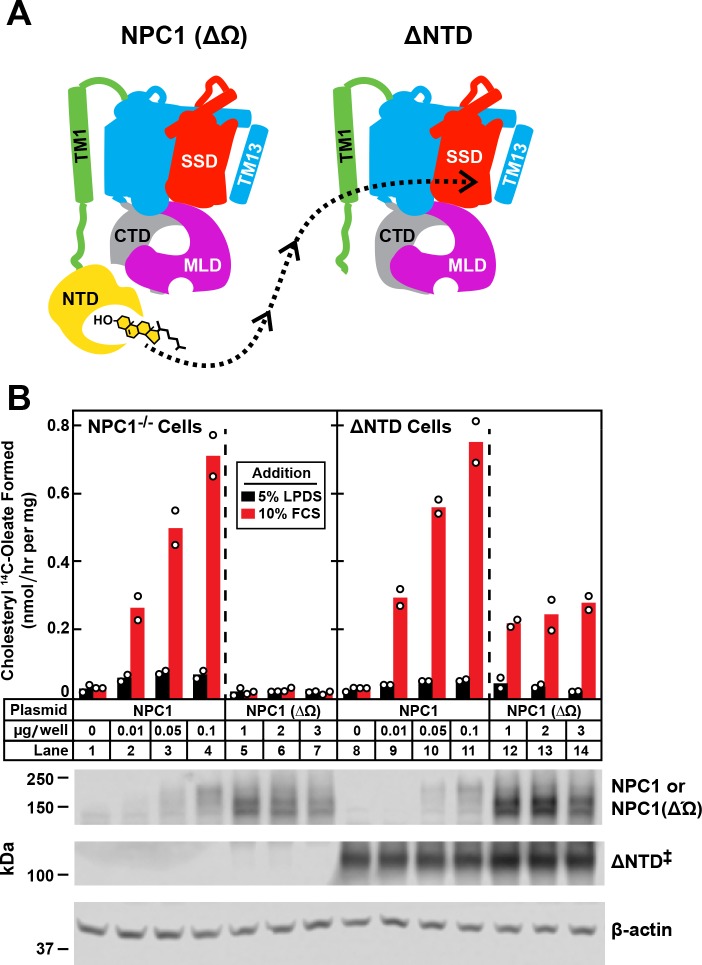
Figure 6. Transfer of cholesterol from NPC1(∆Ω) to ∆NTD as determined by cholesterol esterification assay.
(A) Model showing how the NTD of NPC1(∆Ω) might transfer its cholesterol to the SSD of ∆NTD. (B) Cholesterol esterification assay. On day 0, NPC1-/- cells and ∆NTD cells were set up for experiments as described in Figure 4 and transfected on day one with the indicated plasmids. All dishes contained a total of 3 µg of DNA adjusted with pcDNA3.1. After incubation for 24 hr, cells were washed once with PBS and switched to medium A with 5% LPDS containing 50 µM sodium compactin and 50 µM sodium mevalonate. On day 3, the cells received fresh medium B containing compactin and mevalonate in the presence of either 5% LPDS or 10% FCS. After incubation for 4 hr at 37°C, each cell monolayer was pulse-labeled for 2 hr with 0.1 mM sodium [14C]oleate (9452 dpm/nmol). The cells were then harvested for measurement of their content of cholesteryl [14C]oleate and [14C]triglycerides. Each bar indicates the mean of duplicate incubations with individual values shown. The mean cellular content of [14C]triglycerides in the presence of FCS was not significantly different in NPC1-/- and ∆NTD cells (11.8 and 14.8 nmol/hr per mg protein, respectively). The bottom panel shows immunoblots of whole cell extracts (40 μg) using 3.6 μg/ml rabbit polyclonal anti-NPC1(NTD) that detects both NPC1 ((lanes 2–4, 9–11) and NPC1 (∆Ω) (lanes 5–7, 12–14), 0.36 μg/ml rabbit monoclonal anti-NPC1 that detects ∆NTD* (lanes 8–14), and 0.2 μg/ml of mouse monoclonal anti-β-actin. ‡ denotes the endogenous, stably transfected ∆NTD.

