. 2017 Sep 28;6(6):930–946. doi: 10.1039/c7tx00152e

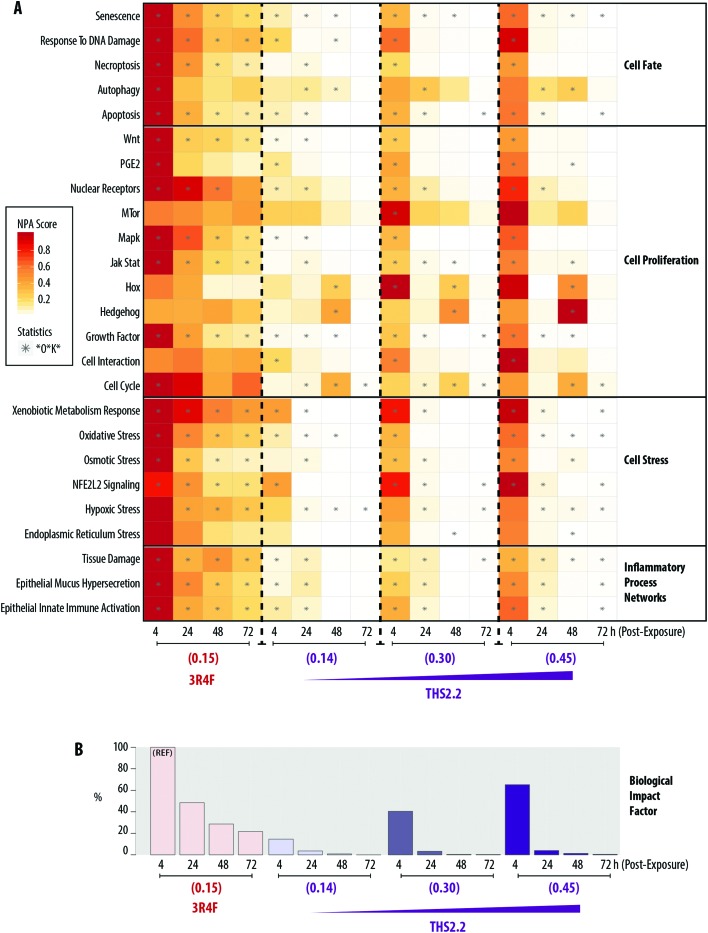
Fig. 7. Biological Impact Factor (BIF) derived from cumulated network perturbations following 3R4F and THS2.2 exposure compared with the air controls. (A) Heatmap of network perturbation amplitude (NPA) scores of biological networks impacted by 3R4F smoke and THS2.2 aerosol exposure. The network names are listed on the left side of the heatmap, with the corresponding network family on the right side of the heatmap. The color gradient represents the NPA scores, which were normalized to the maximum NPA score per network. The star symbols (*) in the heatmap indicate that the network is significantly impacted by exposure (i.e., the three values—the confidence interval, *O, and K* statistics—are below 0.05, as described in the Materials and methods section). (B) Percentage relative BIF is plotted on the y-axis. The highest BIF value is taken as 100% as the reference (REF). Nicotine concentrations in the smoke or aerosol are indicated for each group (mg L–1).

Fig. 7