Figure 1.
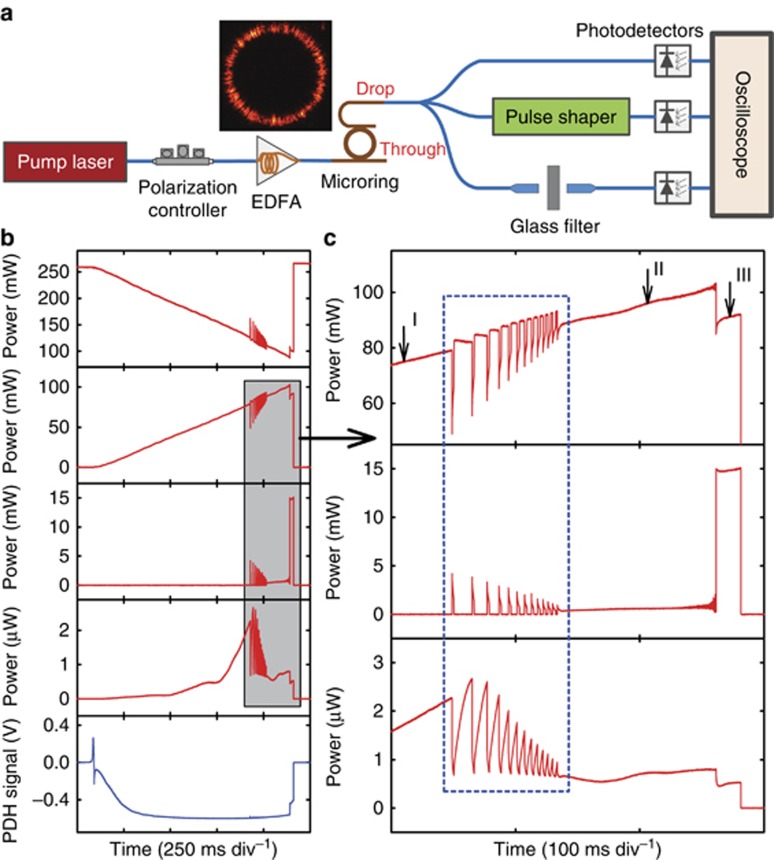
Second-harmonic-assisted comb generation in a normal dispersion SiN microring resonator. (a) Experimental setup. The inset shows the microscope image of the microring with second-harmonic radiation. (b) Transition curves when the pump laser scans across the resonance from shorter to longer wavelengths. From top to bottom: total IR power at the through port, total IR power at the drop port, IR comb power excluding the pump line at the drop port, second-harmonic power at the drop port, PDH signal (the measurement setup is not shown in a). (c) Zoomed-in details in the gray region marked in b. The region marked in a blue dashed box shows a millisecond timescale oscillation. The drop-port comb spectra at different detuning stages (I, II and III) are shown in the following Figure 2.

