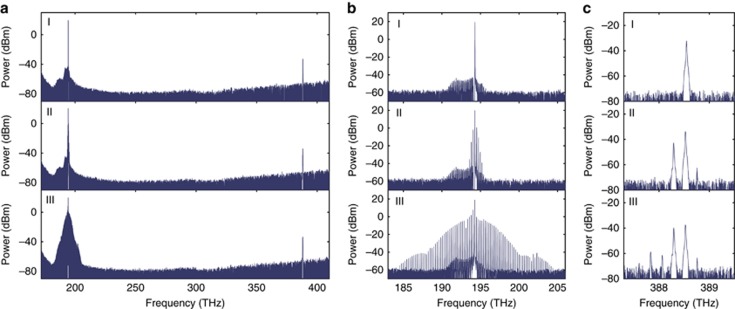
Figure 2.
Drop-port comb spectra at the different detuning stages marked in Figure 1c. (a) Spectra measured in a range of more than one octave (the increase on the low-frequency side is due to the optical spectrum analyzer background). (b) Zoomed-in IR spectra. (c) Zoomed-in second-harmonic spectra.

