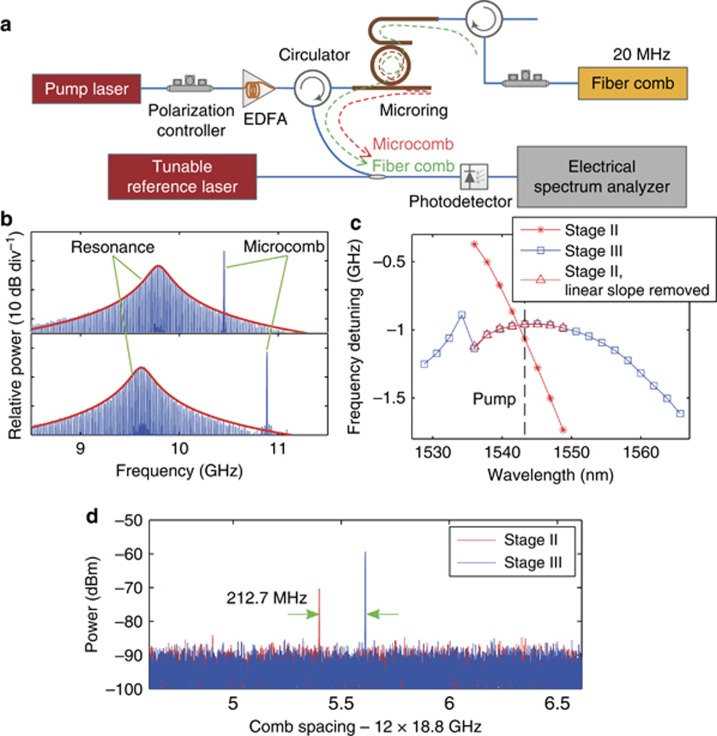
Figure 4.
Hot-cavity detuning measurement. (a) Experimental setup. The frequency of the reference laser is ~10 GHz lower than the microcomb line to be measured. (b) Representative beat notes observed on the electrical spectrum analyzer. (c) Hot-cavity detuning, defined as the resonance frequency minus the microcomb frequency. A change in the linear slope can be observed when the comb transitions from stage II to stage III, indicating a jump in the comb line spacing. (d) Measured microcomb beat note with electro-optic down-mixing, showing the comb line spacing jump.

