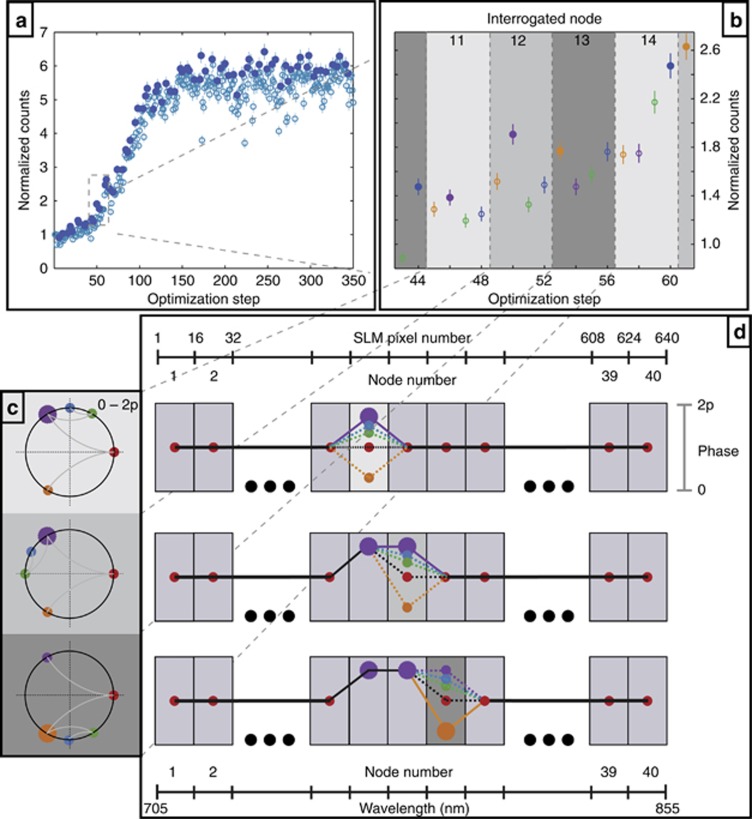
Figure 3.
Schematic of the fast-converging optimization algorithm. (a) Trace of TPPL signal (observable) evolution in a typical deterministic closed-loop optimization run on a single quantum emitter. Full symbols represent optima for each individual interrogated node, with empty symbols representing discarded phase masks. (b) Close up look of the optimization trace. For every node, the phase is changed four times and the phase value producing the highest TPPL signal is kept before moving to the next node. The colors used in the plot correspond to the phases shown in (c). For every node, the algorithm performs a progressive segmentation of the phase space starting with an equally spaced trisection (red, purple and orange points) where the red vertex corresponds to the default phase (zero phase) loaded on the SLM at the start of the optimization. Based on the TPPL signal for the three applied phase masks, the phase interval that produces highest signal is selected and bisected again (green and blue points). This refinement procedure can be iteratively applied at discretion in each node; in practice, we make two refinement measurements at each node, since the intrinsic observable noise prevents us from finding arbitrarily refined solutions. (d) Represents the total phase mask at each run of the optimization algorithm. All the nodes are set to zero (red points) at the beginning. As the algorithm proceeds, the phase of individual nodes is changed separately and interpolation between adjacent nodes is performed to produce a smooth phase mask.

