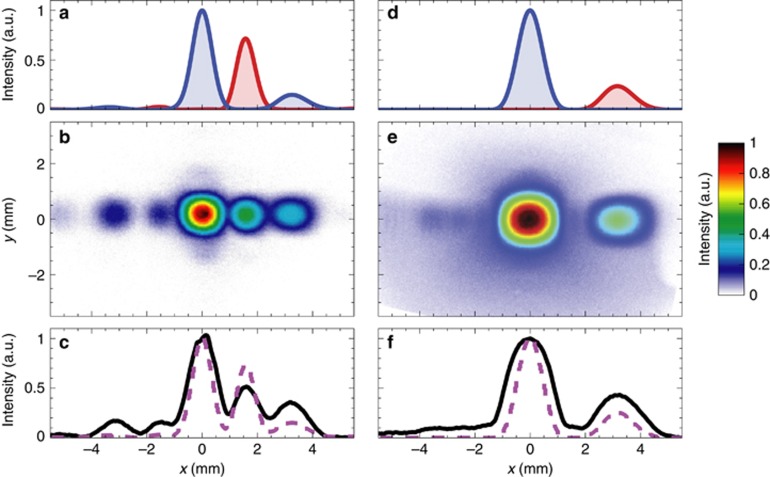
Figure 4.
Far-field characterization (MT1 and MT3) without polarization control. (a) Simulated electric field-intensity profiles (at z = 8 mm and y=0) of the ordinary and anomalous beams (blue and red curves, respectively), for MT1 sample (with parameters as given in Table 1). Results are obtained by averaging the co-polar and cross-polar responses, respectively, under normally-incident x- and y-polarized illuminations at λ = 1.56 μm. (b) Measured field-intensity map at z = 8 mm. (c) Transverse cuts at y = 0 comparing the measured (black-solid curve) and simulated (magenta-dashed curve) results. Numerical results are obtained by averaging the total electric-field intensities for normally-incident x- and y-polarized illuminations. The structure is considered as infinitely-periodic along y, whereas, along the x-direction, a finite-size ∼20 μm is assumed, together with a Gaussian-beam taper (with waist size of 5μm) in the illumination. (d–f) Same as above, but for MT3 sample.

