Figure 3.
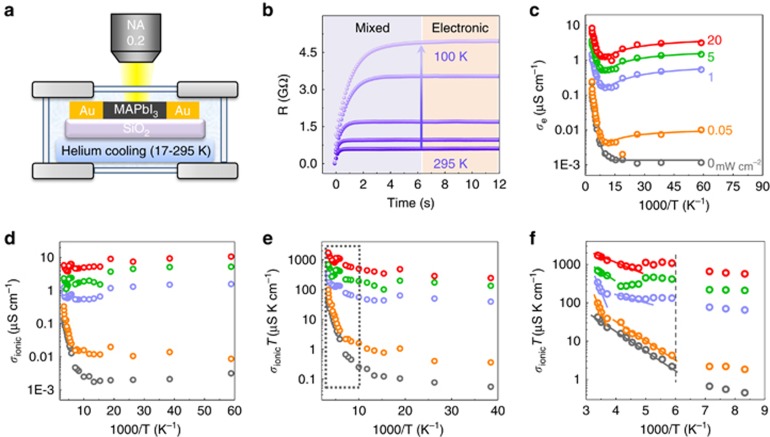
Determination of electronic and ionic conductivities of perovskite film at various temperatures and various illumination intensities from 0 to 20 mW cm−2. (a) The apparatus used in our experiments, with a helium cooling system. Our lateral device was prepared on a silica substrate with Au electrodes and mounted on a sample stage with a cooling system. (b) Five typical galvanostatic curves (resistance vs time) recorded at different temperatures under a 20 pA current and 1 mW cm−2 illumination. The temperatures from bottom to top are 295, 240, 200, 150 and 100 K, respectively. (c) Electronic conductivities at various temperatures from 17 to 295 K as a function of 1000/T under various illumination intensities. The solid lines represent the fitted results for the electronic conductivity from 150 to 17 K. (d) Ionic conductivities at various temperatures from 17 to 295 K under various illumination intensities. (e) Ionic conductivity multiplied by temperature, σionT, as a function of 1000/T under various illumination intensities. (f) Zoomed-in view of the data in the dashed box in e. The dashed line indicates the phase transition temperature. Note that the ionic conductivity under 5 mW cm−2 illumination has been multiplied by 2 to distinguish the green dots from the purple dots in the plot.

