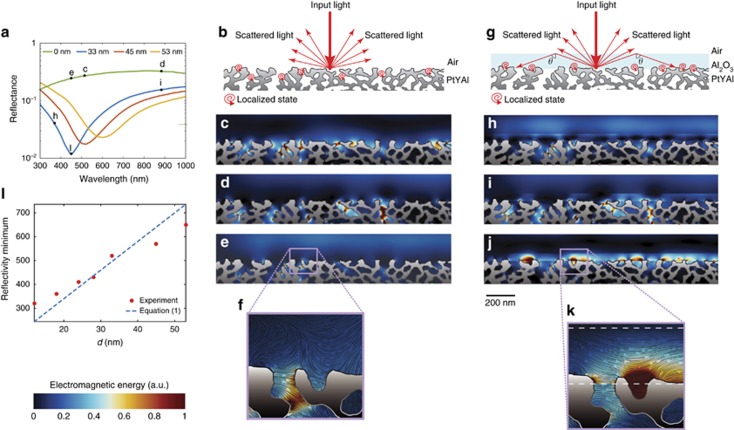
Figure 6.
Mechanisms of structural color formation in the PtYAl cellular network. (a) Normal incidence reflectance spectra obtained from FDTD simulations of the nanoscale Pt network of Figure 1a with different thickness of Al2O3. (b–f) Analysis of the case with no Al2O3 deposited on top of the metal, while in (g–k), summary of the results for an Al2O3 layer of 33 nm. (b and g) A pictorial illustration of light–matter interactions with the sample, without b and with g Al2O3. In the presence of Al2O3, a portion of scattered waves are reflected back in the Al2O3 layer, thus creating an energy flow in the coating layer and a resonant coupling with ENZ regions located in the Al2O3. (c–e and h–j) FDTD-calculated spatial energy distributions in the structure by considering an input wavelength indicated by the corresponding letter in a. Energy distributions are averaged over one optical cycle at steady state. (f and k) A zoomed view of the pink area of e and j and illustrates the electromagnetic energy flow in the structure (arrow colored lines). The flow is superimposed with the corresponding averaged spatial energy distribution. (l) Comparison of the reflectivity minimum shift observed in experiments (Figure 4) with theoretical predictions based on the model illustrated in g.

