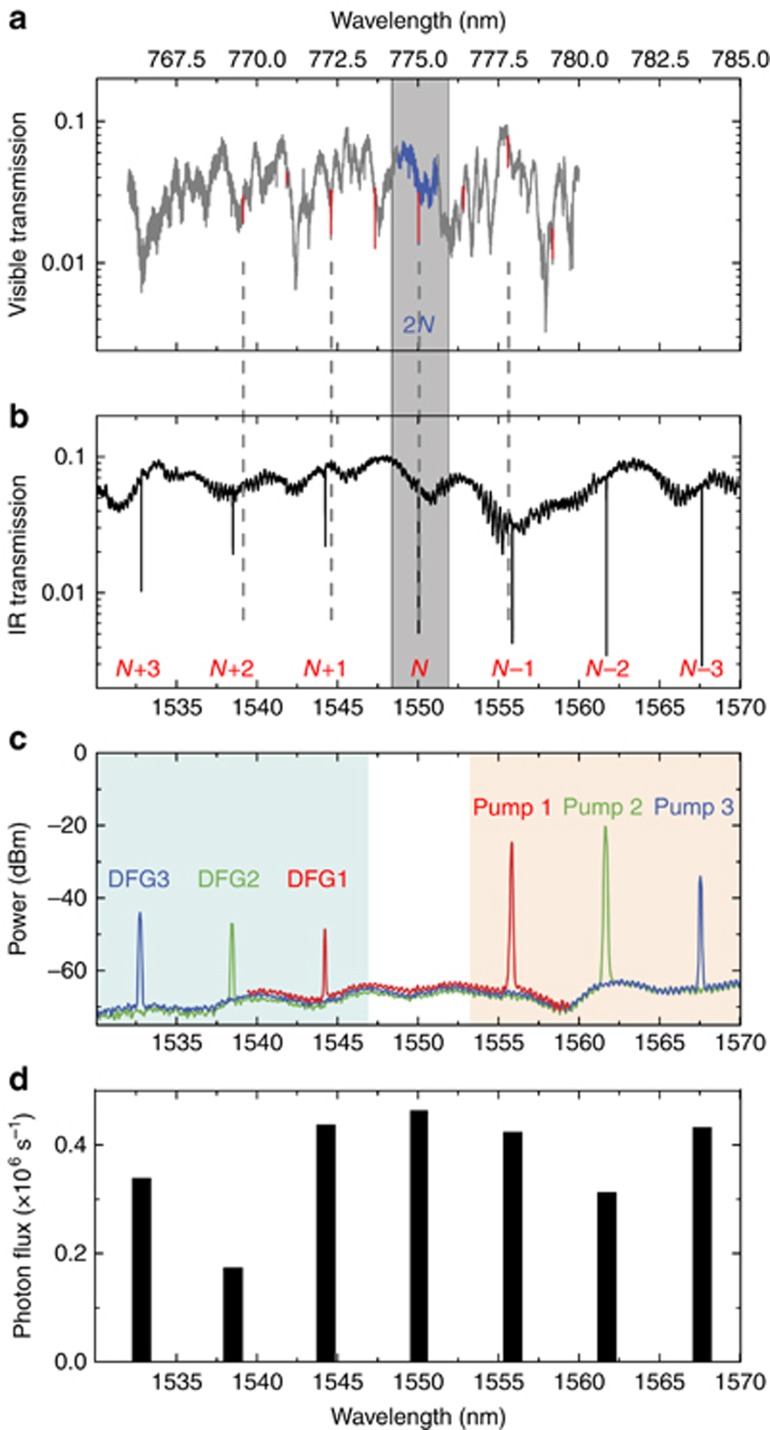
Figure 2.
Linear and nonlinear characteristics of the χ(2) source. (a,b) Transmission spectra of the microring resonator. Four gray dashed lines are aligned with the visible TM2 mode resonances. Gray region shows the phase-matched mode pair (TM2,2N and TM0,N) for SHG and degenerate SPDC, whose resonances are aligned within the linewidth of IR-mode resonance. (a) Visible light transmission spectrum, with TM2 mode resonances emphasized by red lines. The quality factor of the visible optical mode (TM2,2N) is 1.1 × 10⁵. (b) IR-light transmission spectrum, with TM0 modes identified by the azimuthal mode number. The typical quality factor of the IR mode is 2 × 10⁵. (c) Difference frequency generation (DFG) measured by optical spectrum analyzer. Peaks due to input IR pump lasers are shown in the light orange region and generated DFG signals are shown in the light green region. Visible pump laser with 1.9 mW power on chip is fixed on resonance with TM2,2N mode. (d) Single-photon flux arriving at the detector chip from the degenerate and nearest three groups of non-degenerate down-conversion. The counts are calibrated by the wavelength-dependent detection efficiency (Supplementary Section II).

