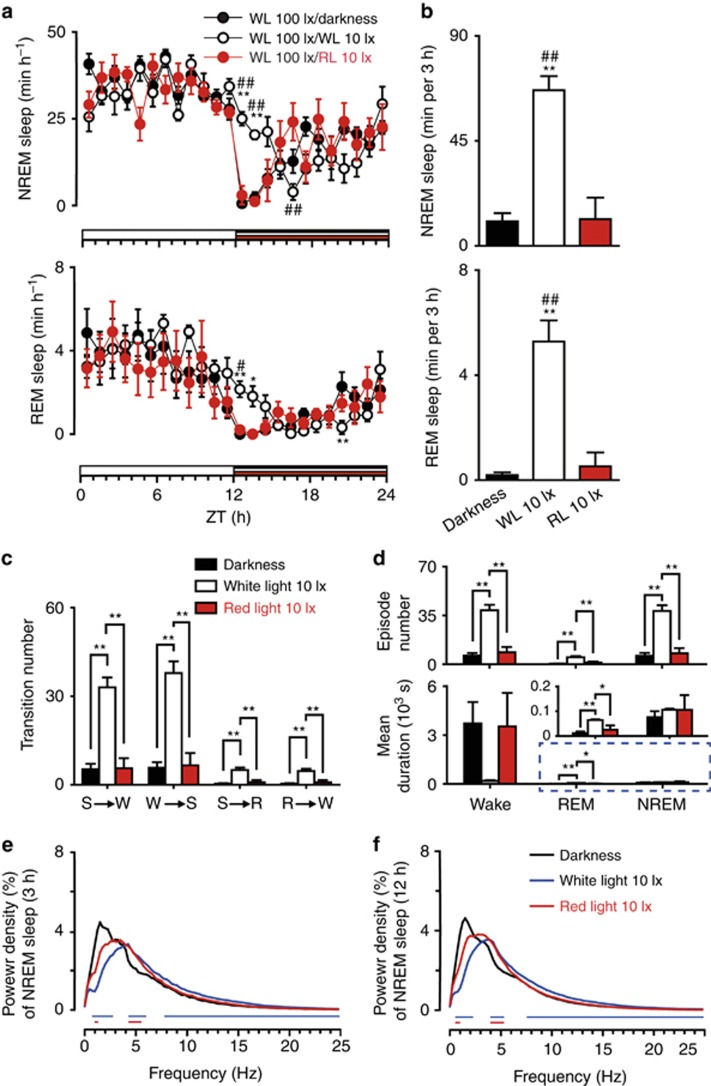
Figure 6.
Effects of 10 lx white or red light exposure for 12 h on sleep during the entire dark phase. (a) Time course changes in NREM sleep and REM sleep in mice exposed to 100 lx white light (WL) during the day and exposed to darkness, 10 lx WL and red light (RL) at night. Each cycle represents the hourly mean±SEM of NREM and REM sleep. Black, white and red circles indicate the profiles of darkness, white and red light treatments, respectively. The horizontal black, white and red bars on the x axes indicate darkness, white light and red light treatments, respectively. *P<0.05, **P<0.01 indicate significant differences between white light and darkness. #P<0.05, ##P<0.01 indicate significant differences between white light and red light. Data shown are assessed via two-way ANOVA followed by a Bonferroni test. (b) Total time spent in NREM sleep and REM sleep for 3 h after 10 lx white or red light treatment. Black, white and red bars show the profiles of darkness, white and red light treatments, respectively. **P<0.01 or ##P<0.01 indicates significant differences compared with darkness or to red light, respectively. Data were assessed via one-way ANOVA followed by a Bonferroni test. (c, d) Stage transition (c), episode number and mean duration (d) in a 3-h period after the treatment of 10 lx white or red light. Black, white and red bars show the profiles of darkness, white and red light treatments, respectively. *P<0.05, **P<0.01 indicate significant differences between two groups. Data were assessed via one-way ANOVA followed by a Bonferroni test. R, REM sleep; S, NREM sleep; W, Wake. (e, f), EEG power density of NREM sleep within the first 3 h (e) and the entire 12 h (f) during the dark phase. Values are means±SEM (n=5–8). Blue and red horizontal bars indicate the location of a statistically significant difference (P<0.05, two-tailed unpaired t-test) between white or red light and continuous darkness, respectively.

